
Software asset management, on screens people can read
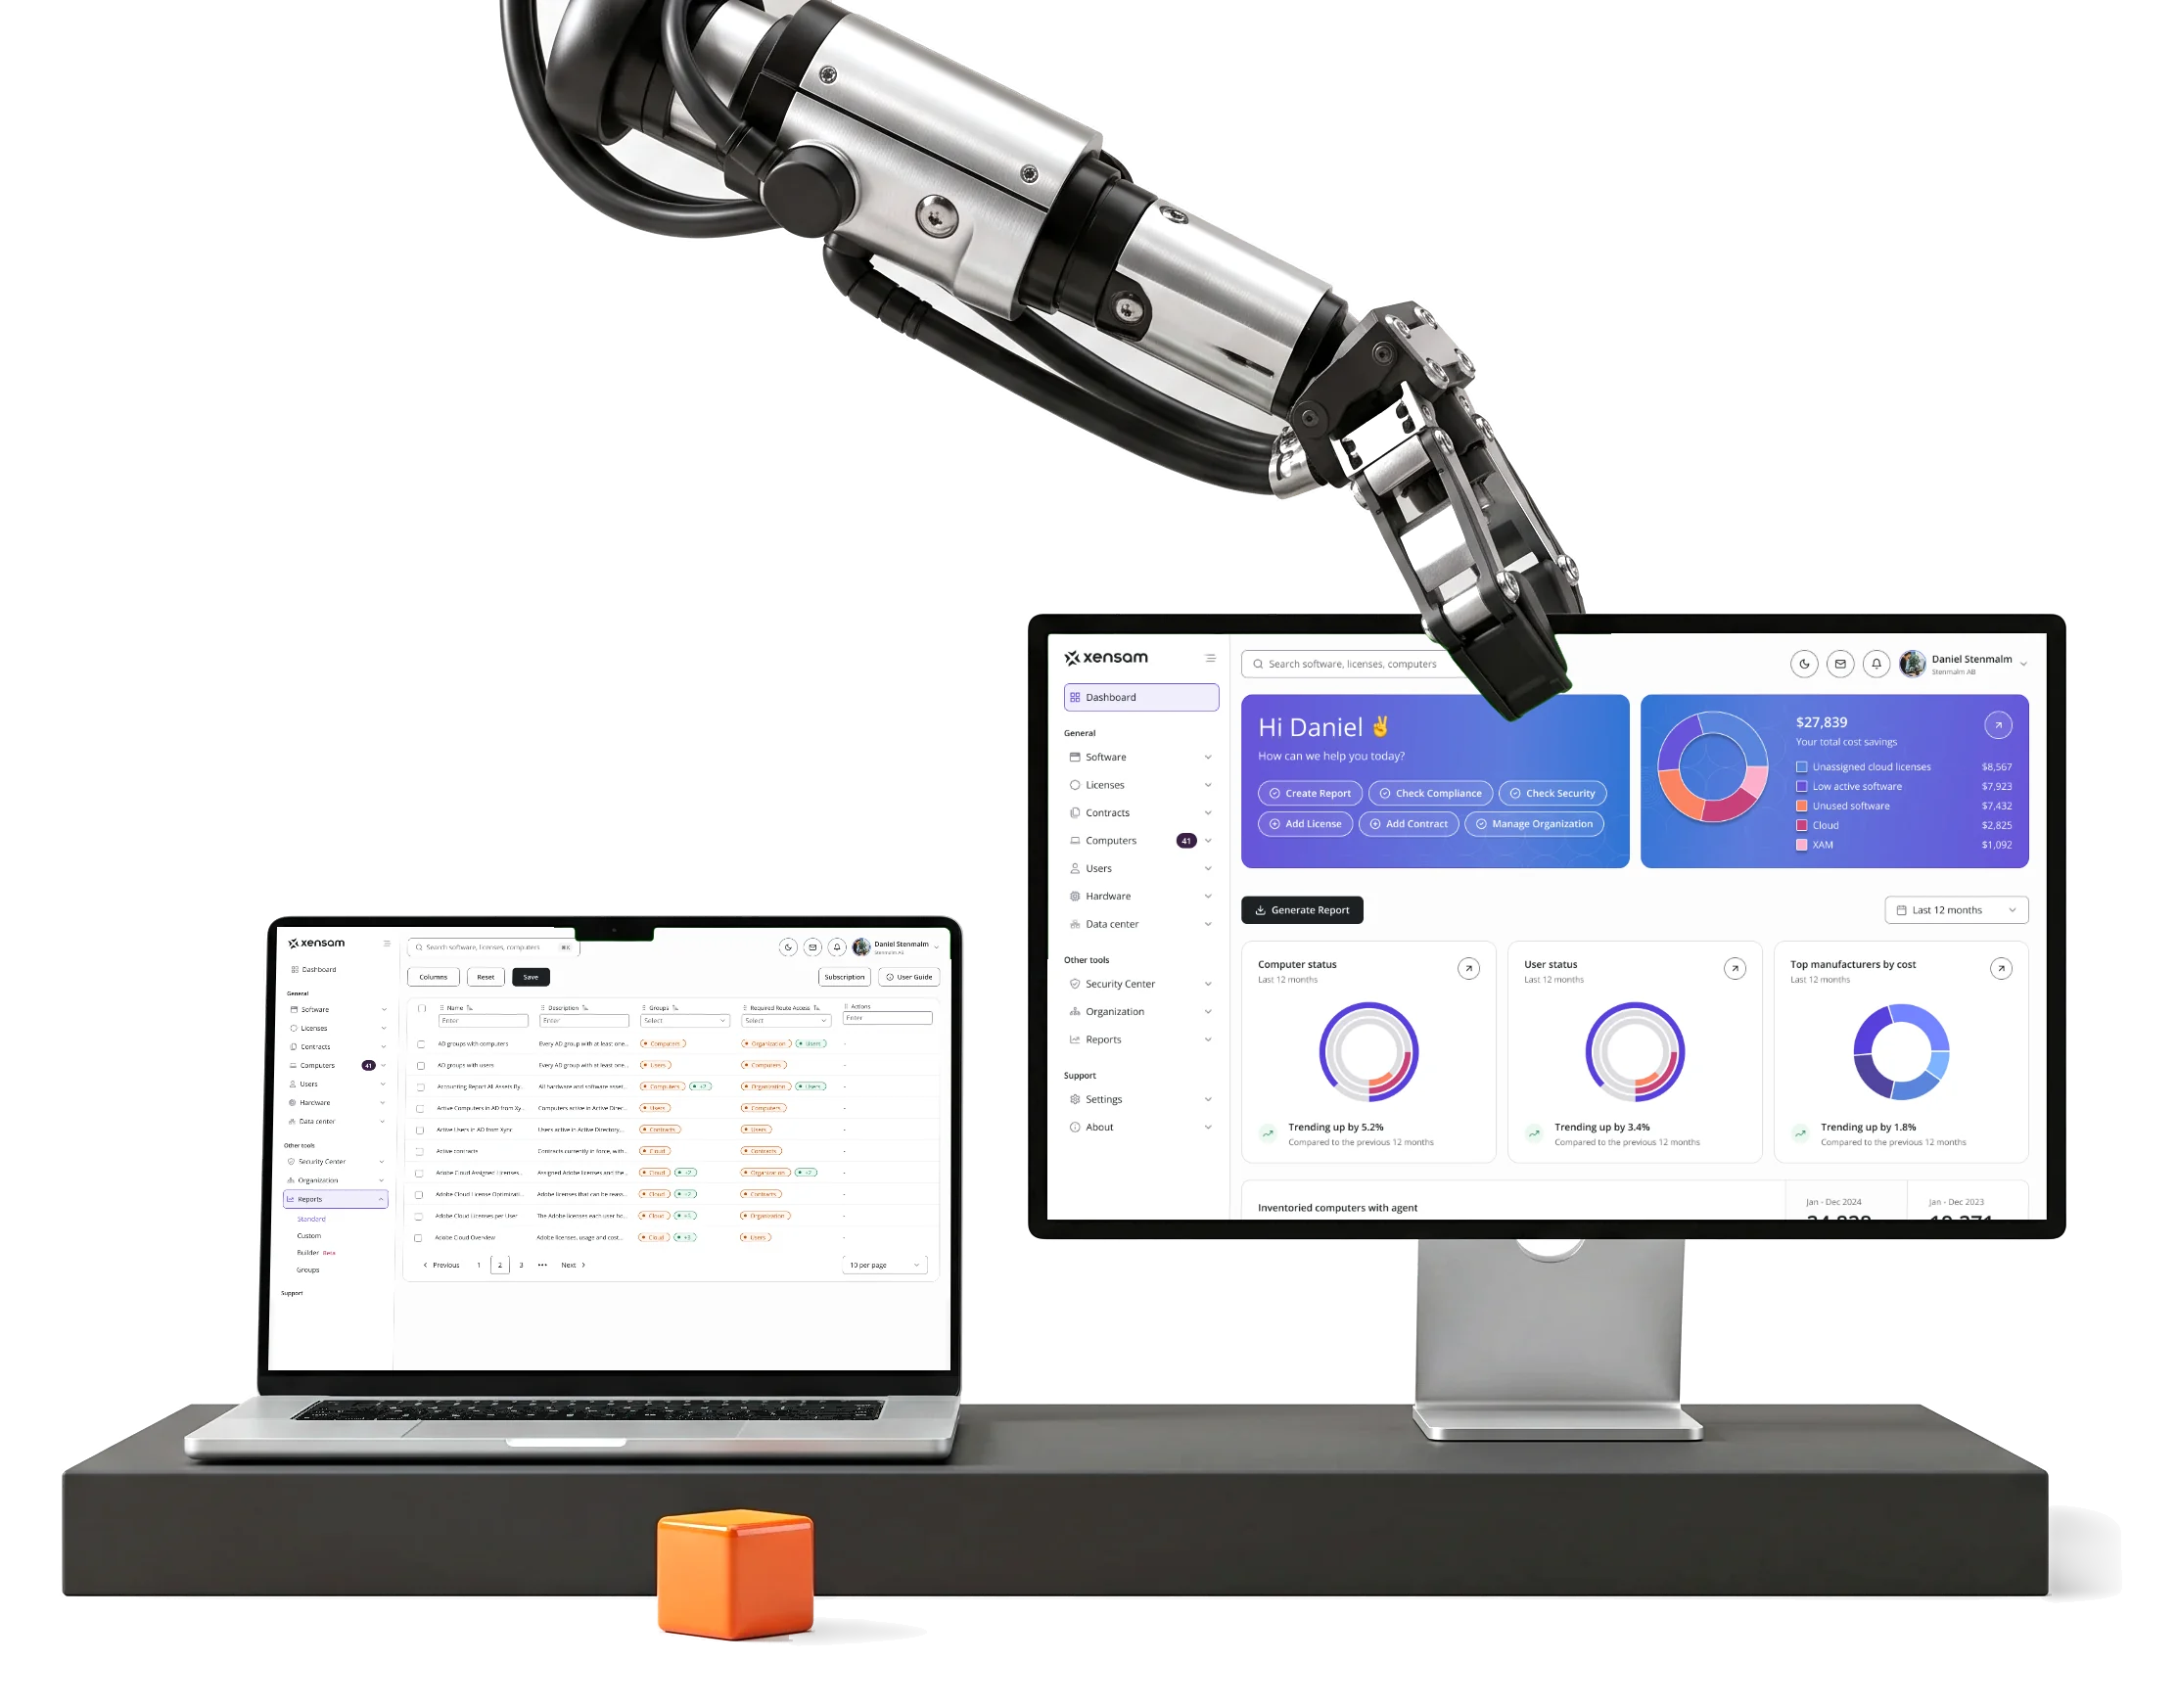
Xensam shows large organisations what software they run and what they are licensed for.We redesigned its desktop platform, in light and dark.

- 2
- roles, end to end Viewer and Admin, every screen made for both
- Dark
- mode, product-wide alongside the light theme
- Tailwind
- CSS handoff components planned one-to-one with shadcn-style code
Project summary
Xensam is an AI-powered enterprise software asset management platform: it finds the software and hardware an organisation runs across SaaS, on-premise and cloud, and checks it against what the organisation is licensed for. We did a full UI redesign of its existing desktop platform for Viewer and Admin, a full design system and a Tailwind CSS handoff for its developers.
What runs through the platform
One chain, from what is installed to what it costs:
-
Dashboard
- Cost savings
- Status
- Trends
-
Software
- Overview
- Local inventory
- Raw inventory
-
Licenses
- Records
- Compliance
- Peak level
-
Hardware
- Devices
- Data centers
- Clusters and VMs
-
Reports
- Standard reports
- Subscriptions
-
Account
- Notifications
- Sessions
- S3 storage
- Depth and First look
- Every column a license manager needs, with the answer readable before the table.
- Many modules and One logic
- Software, licenses, hardware and data centers filtered, edited and read the same way.
- Viewer and Admin
- Two complete products on one set of screens, in light and in dark.
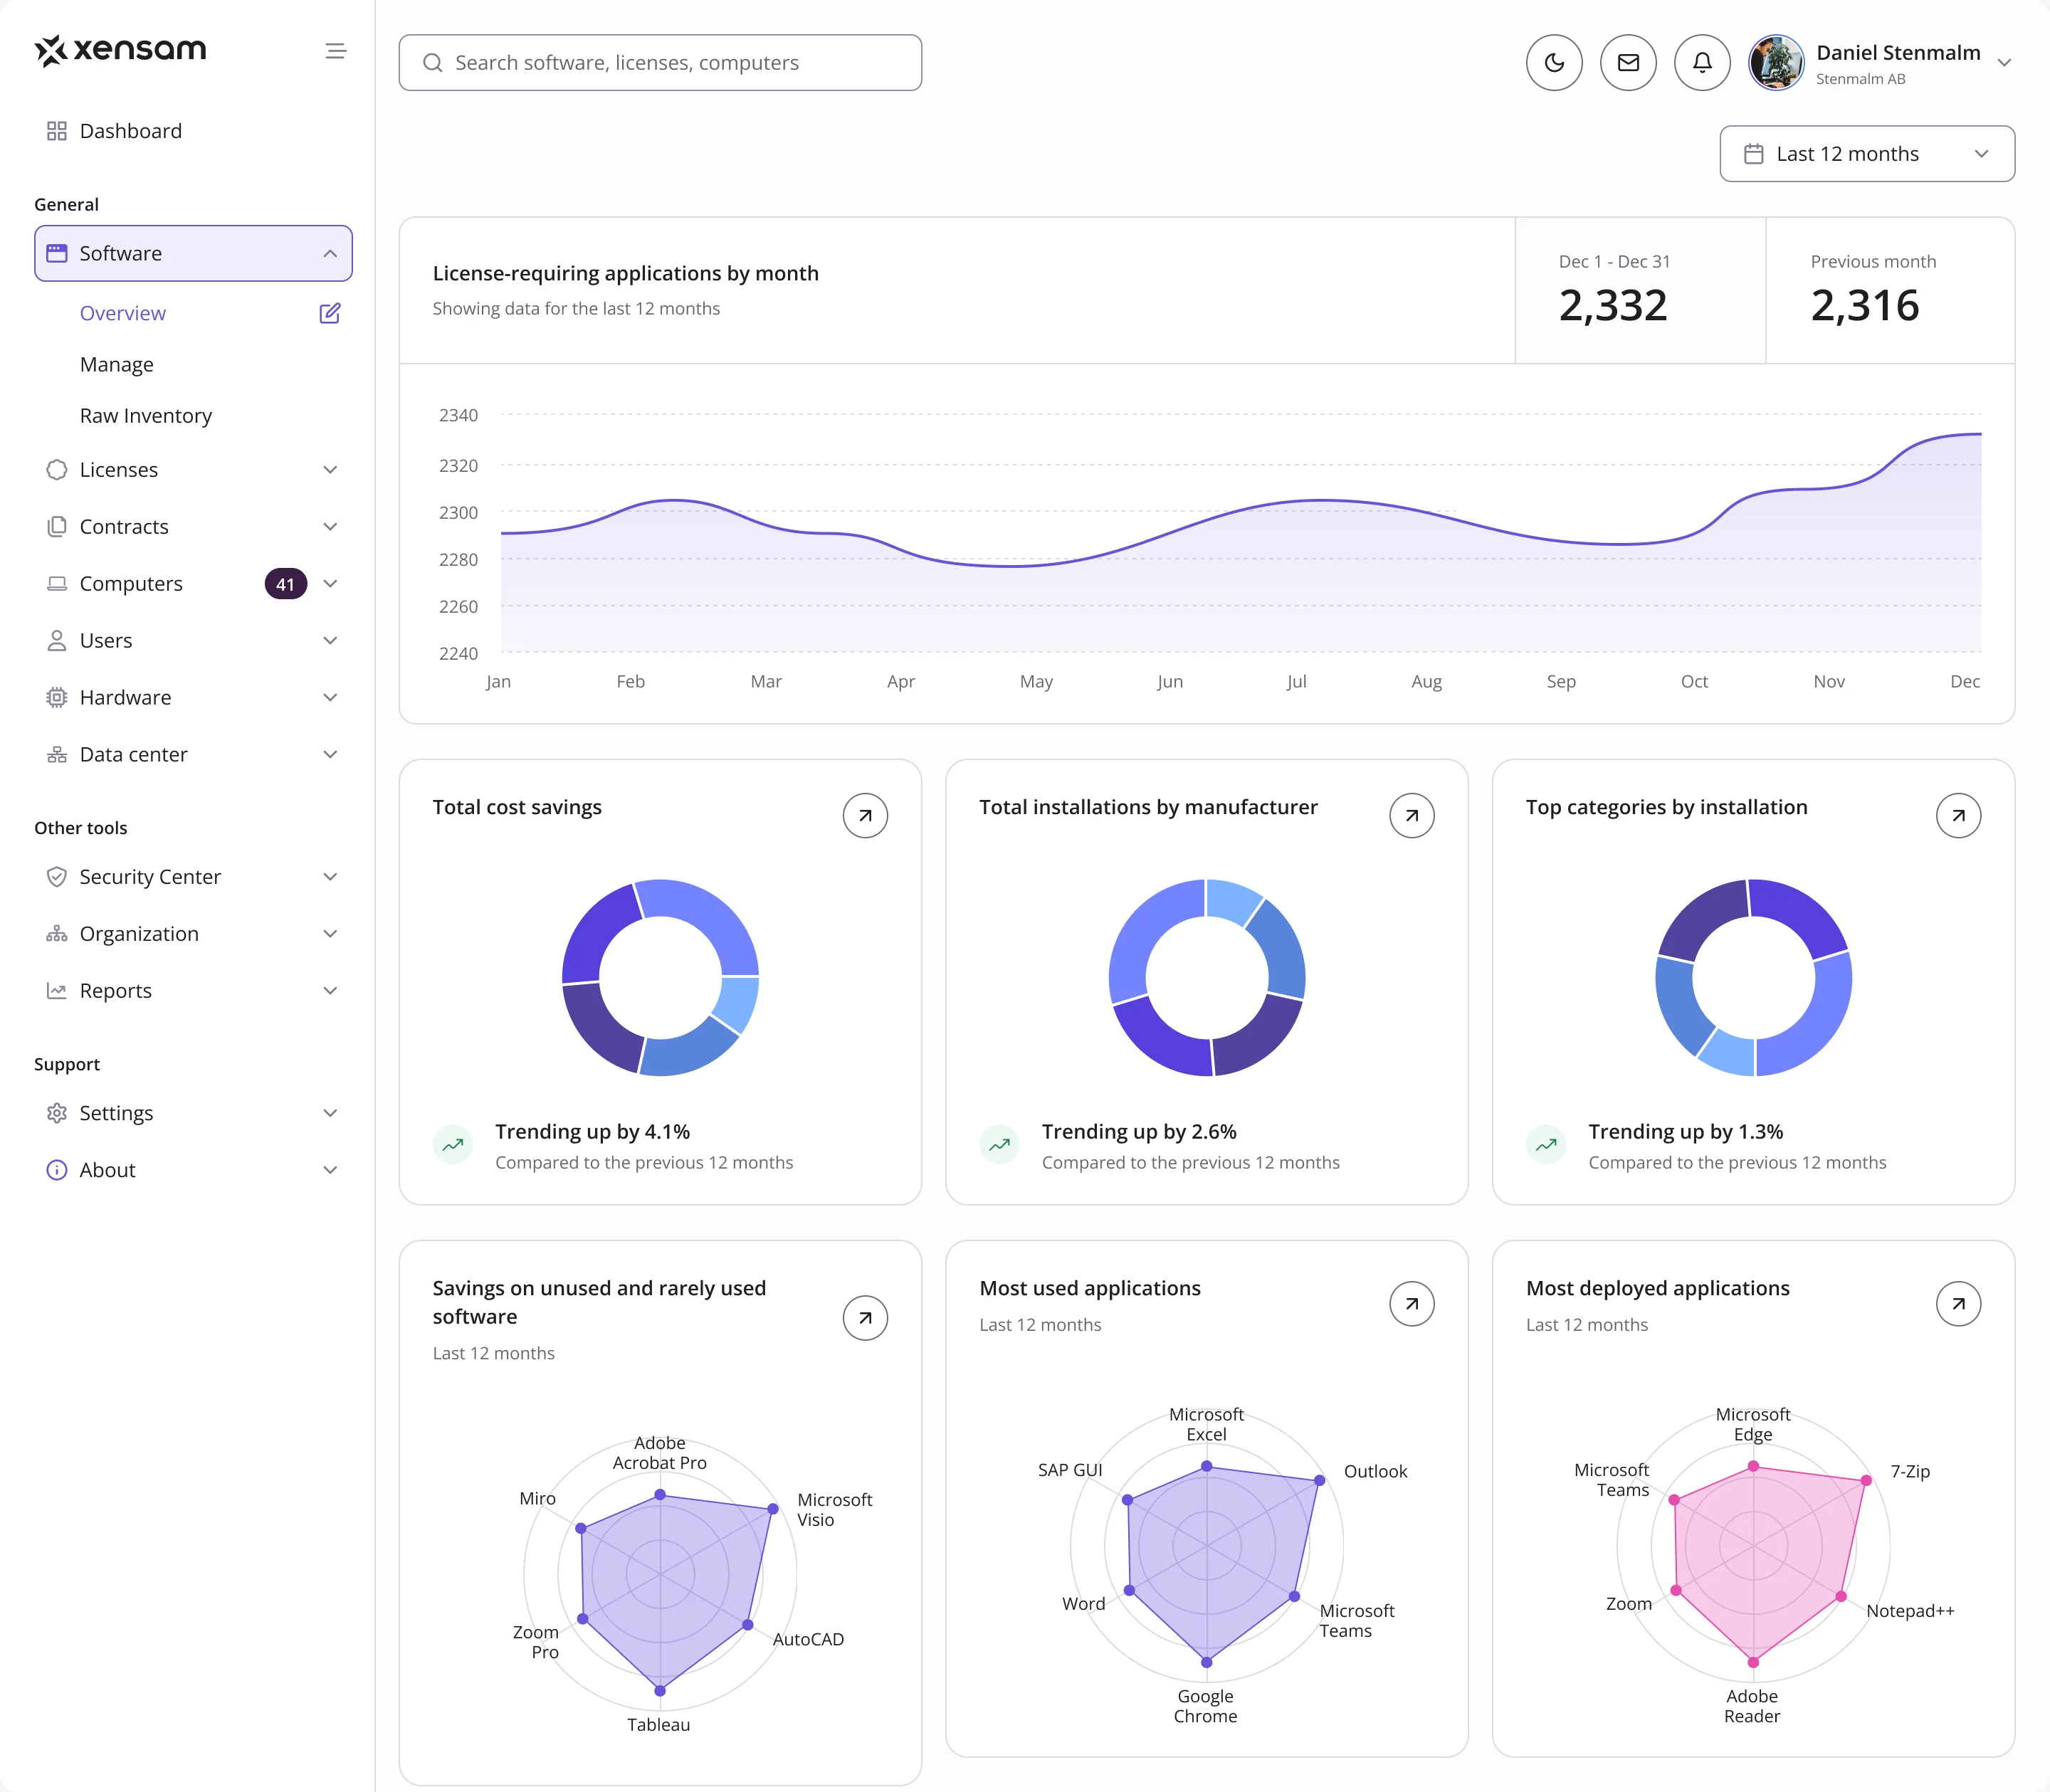
The whole estate, read top to bottom
- Found
- Savings, machine and user status, license waste and usage all compete for the first screen of a platform like this, and at equal weight nothing leads.
- Decided
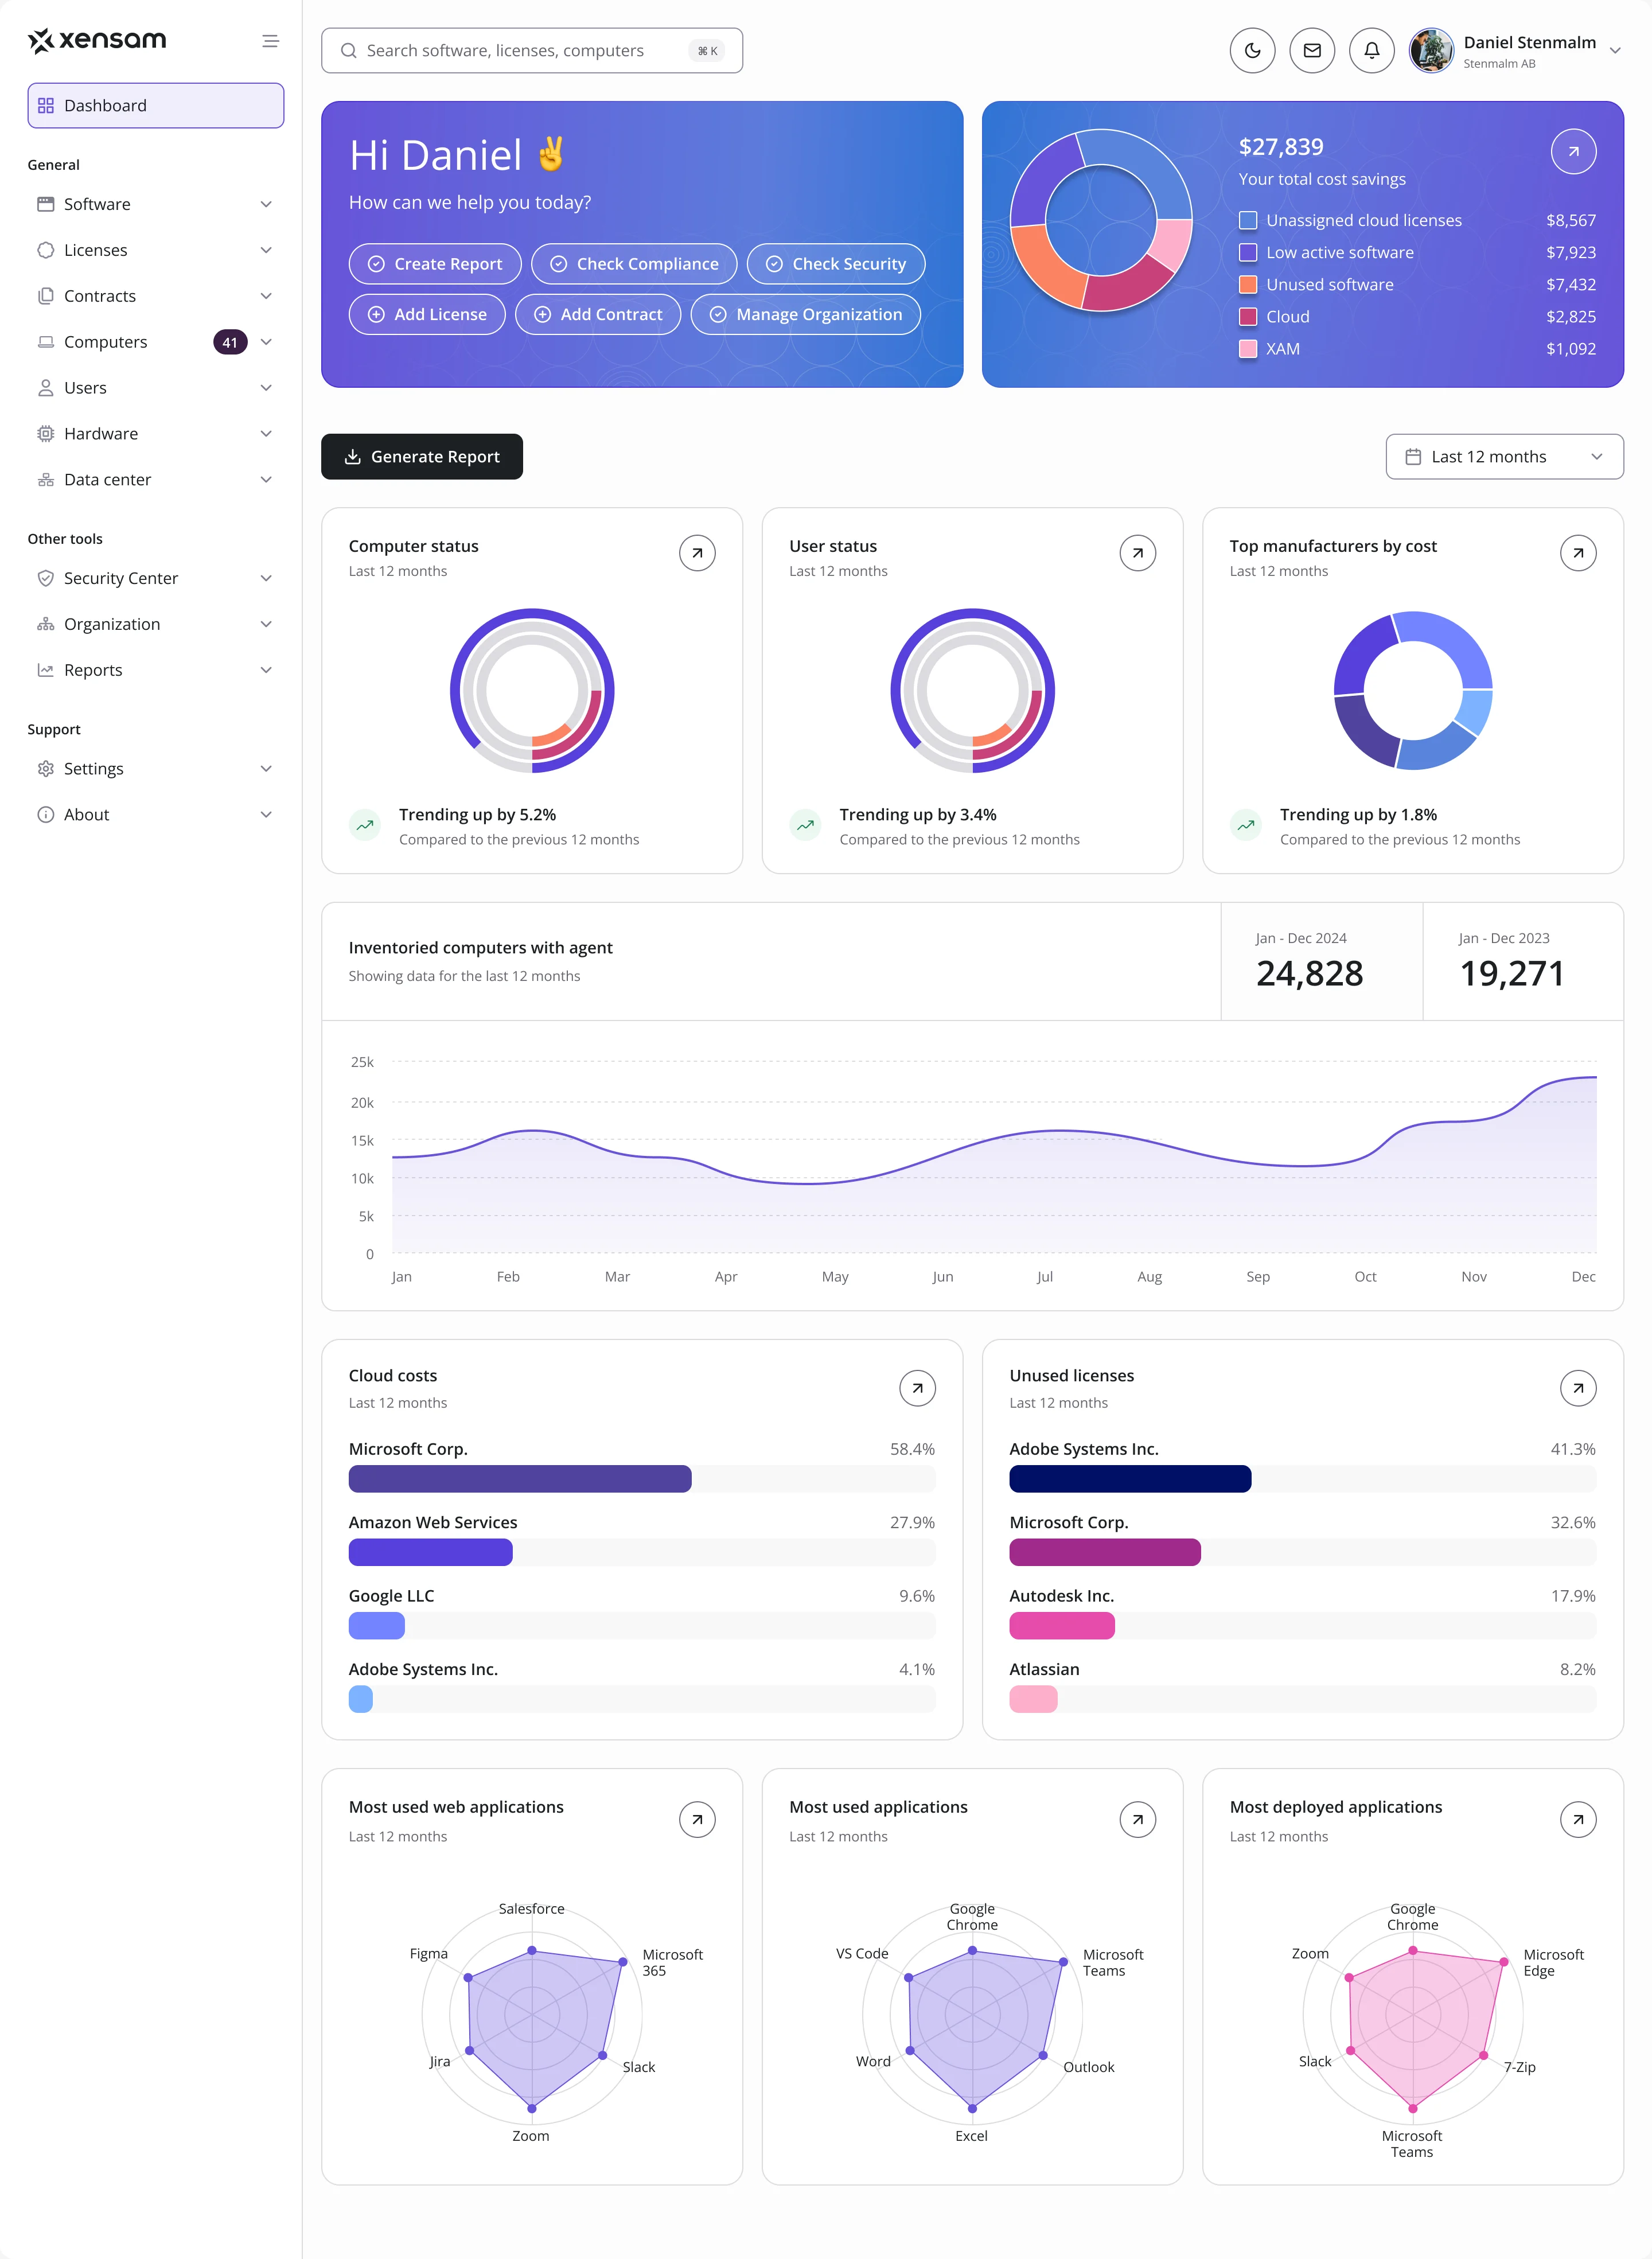
- One order on the dashboard: what you can do now and what you can save, then status, then the trend, then where money goes, then what people actually run.
- For the user
- An IT or license manager sees the savings and the state of the estate before opening a single module.
-
What to do, what to save
Quick actions beside the total savings, split by where they come from.
-
The state of things
Computers, users and cost by manufacturer, each against the last twelve months.
-
The trend
Inventoried computers month by month, this year against the last.
-
Where money goes
Cloud costs and unused licenses, vendor by vendor.
-
What people run
The most used and most deployed applications.
How the work progressed
From the platform as its users knew it to a system Xensam’s developers could build from.
-
Discovery
What the existing platform did, screen by screen, from a user’s seat
Artifact A review of the live product with Viewer access, its palette taken apart
-
User Flow
How software, licenses, hardware, data centers, reports and the account connect
Artifact Information architecture, user flows and screen maps
-
Wireframes
Where dense tables, filters and charts sit, before any styling
Artifact Wireframes for the core modules
-
Moodboards
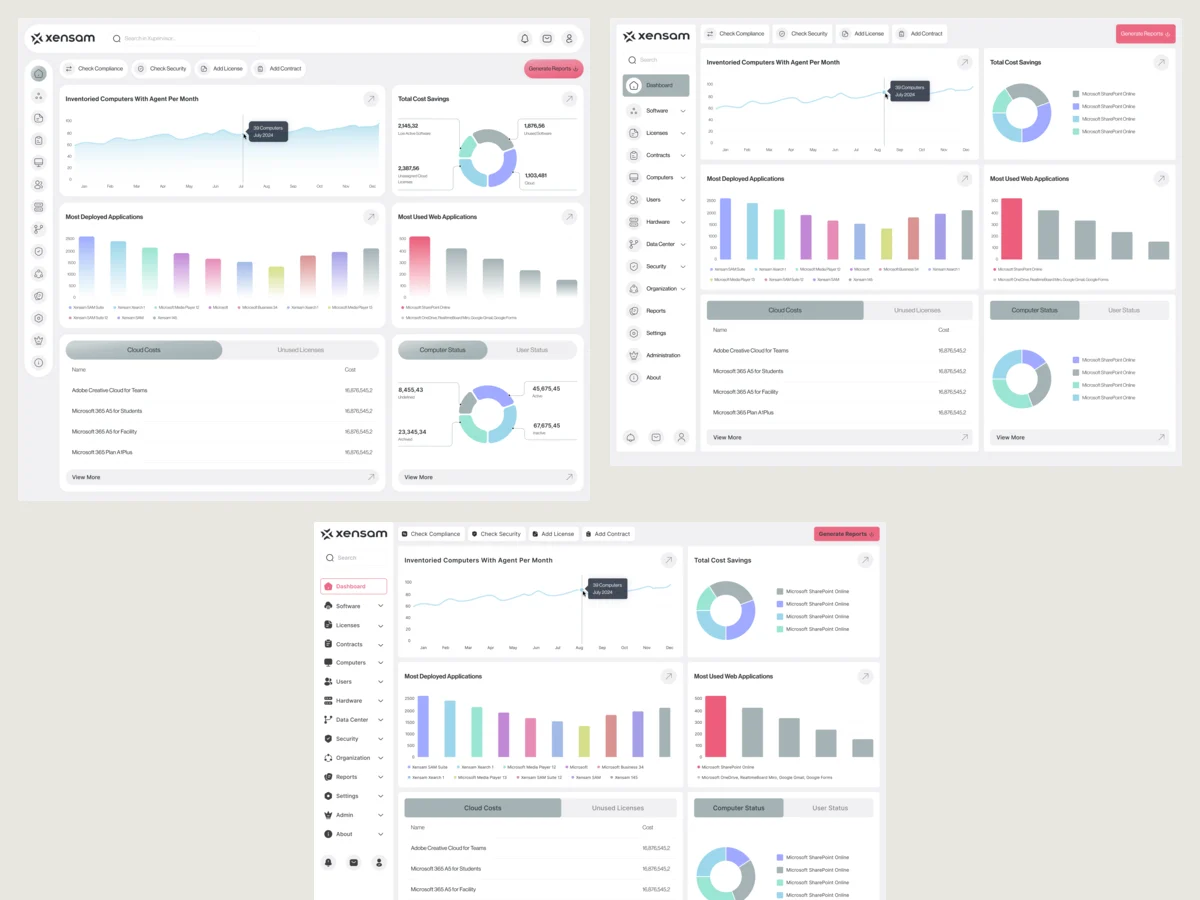
Which look lets dense data stay calm
Artifact Three style directions drawn on the same screens
-
UI & Design system
One set of components for tables, filters, charts and forms, in light and dark
Artifact Final desktop UI for Viewer and Admin, a full design system and UI kit
-
Delivery
What developers needed to build it in their own stack
Artifact A clickable prototype, screen maps, and components planned one-to-one with shadcn, handed off for Tailwind CSS
From the first sign-in to every module
- Found
- A platform this broad is entered through one door and then spreads over software, licenses, contracts, computers, users, hardware, data centers, security, organisation and reports.
- Decided
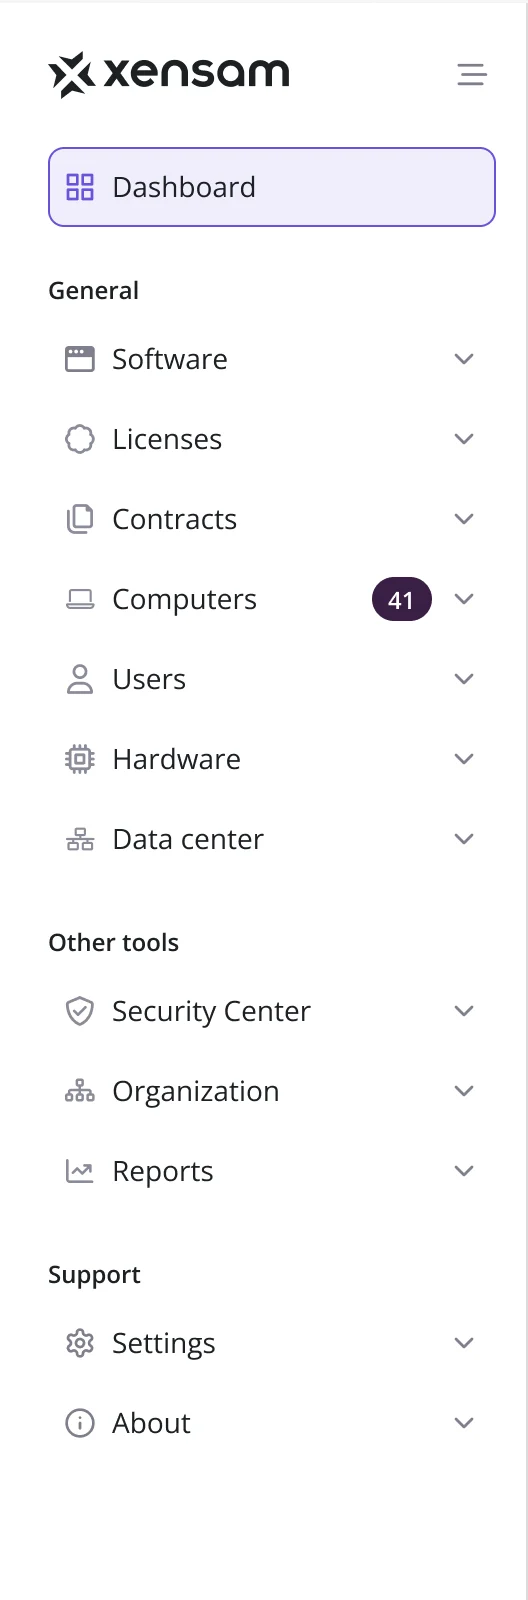
- Every flow mapped screen by screen before the UI, from creating an account to each module, then one side menu that groups the modules into general work, other tools and support.
-
Signing up
Email, password and terms on one screen; a missing password or unticked box is named in place.
Open the full map
-
Logging in
Every way a login can fail drawn as its own state, so each error says which field is wrong.
Open the full map
-
Getting back in
Recovery by email, a resend, then a new password, each step ending on a clear confirmation.
Open the full map
Five jobs Xensam’s users come to it for
In the order a license or IT manager meets them.
Seeing what the estate runs
- Found
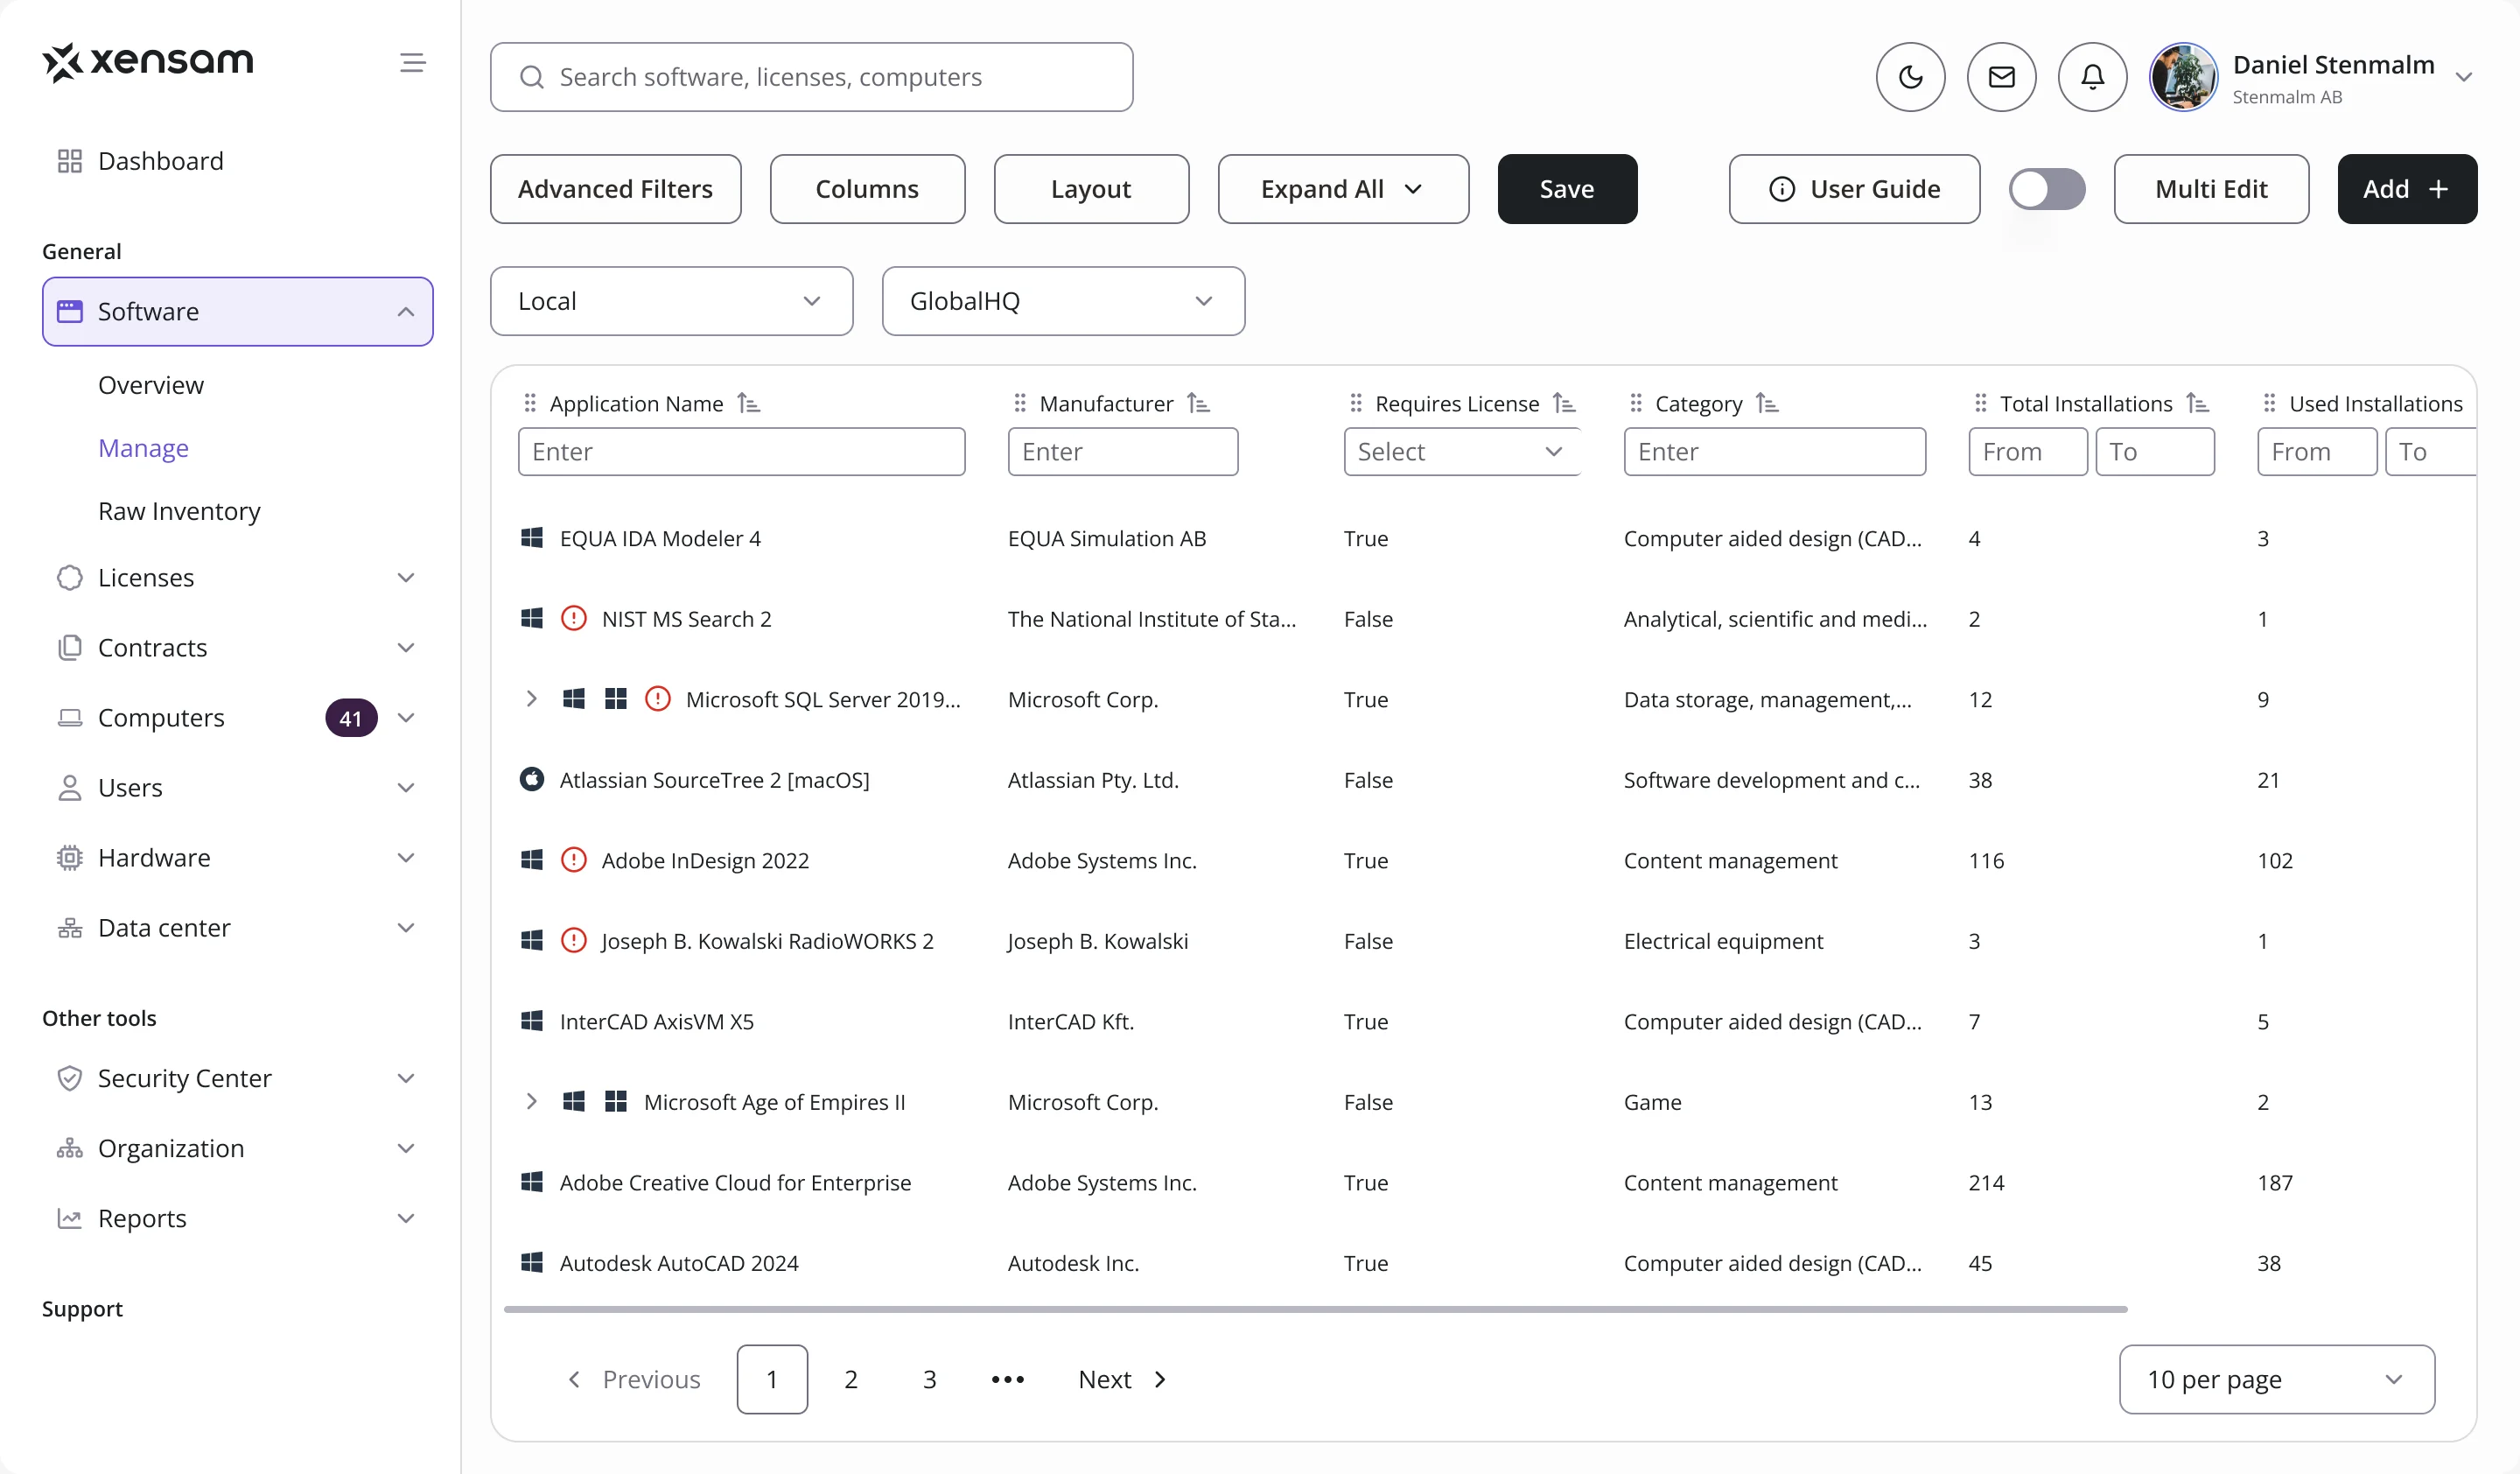
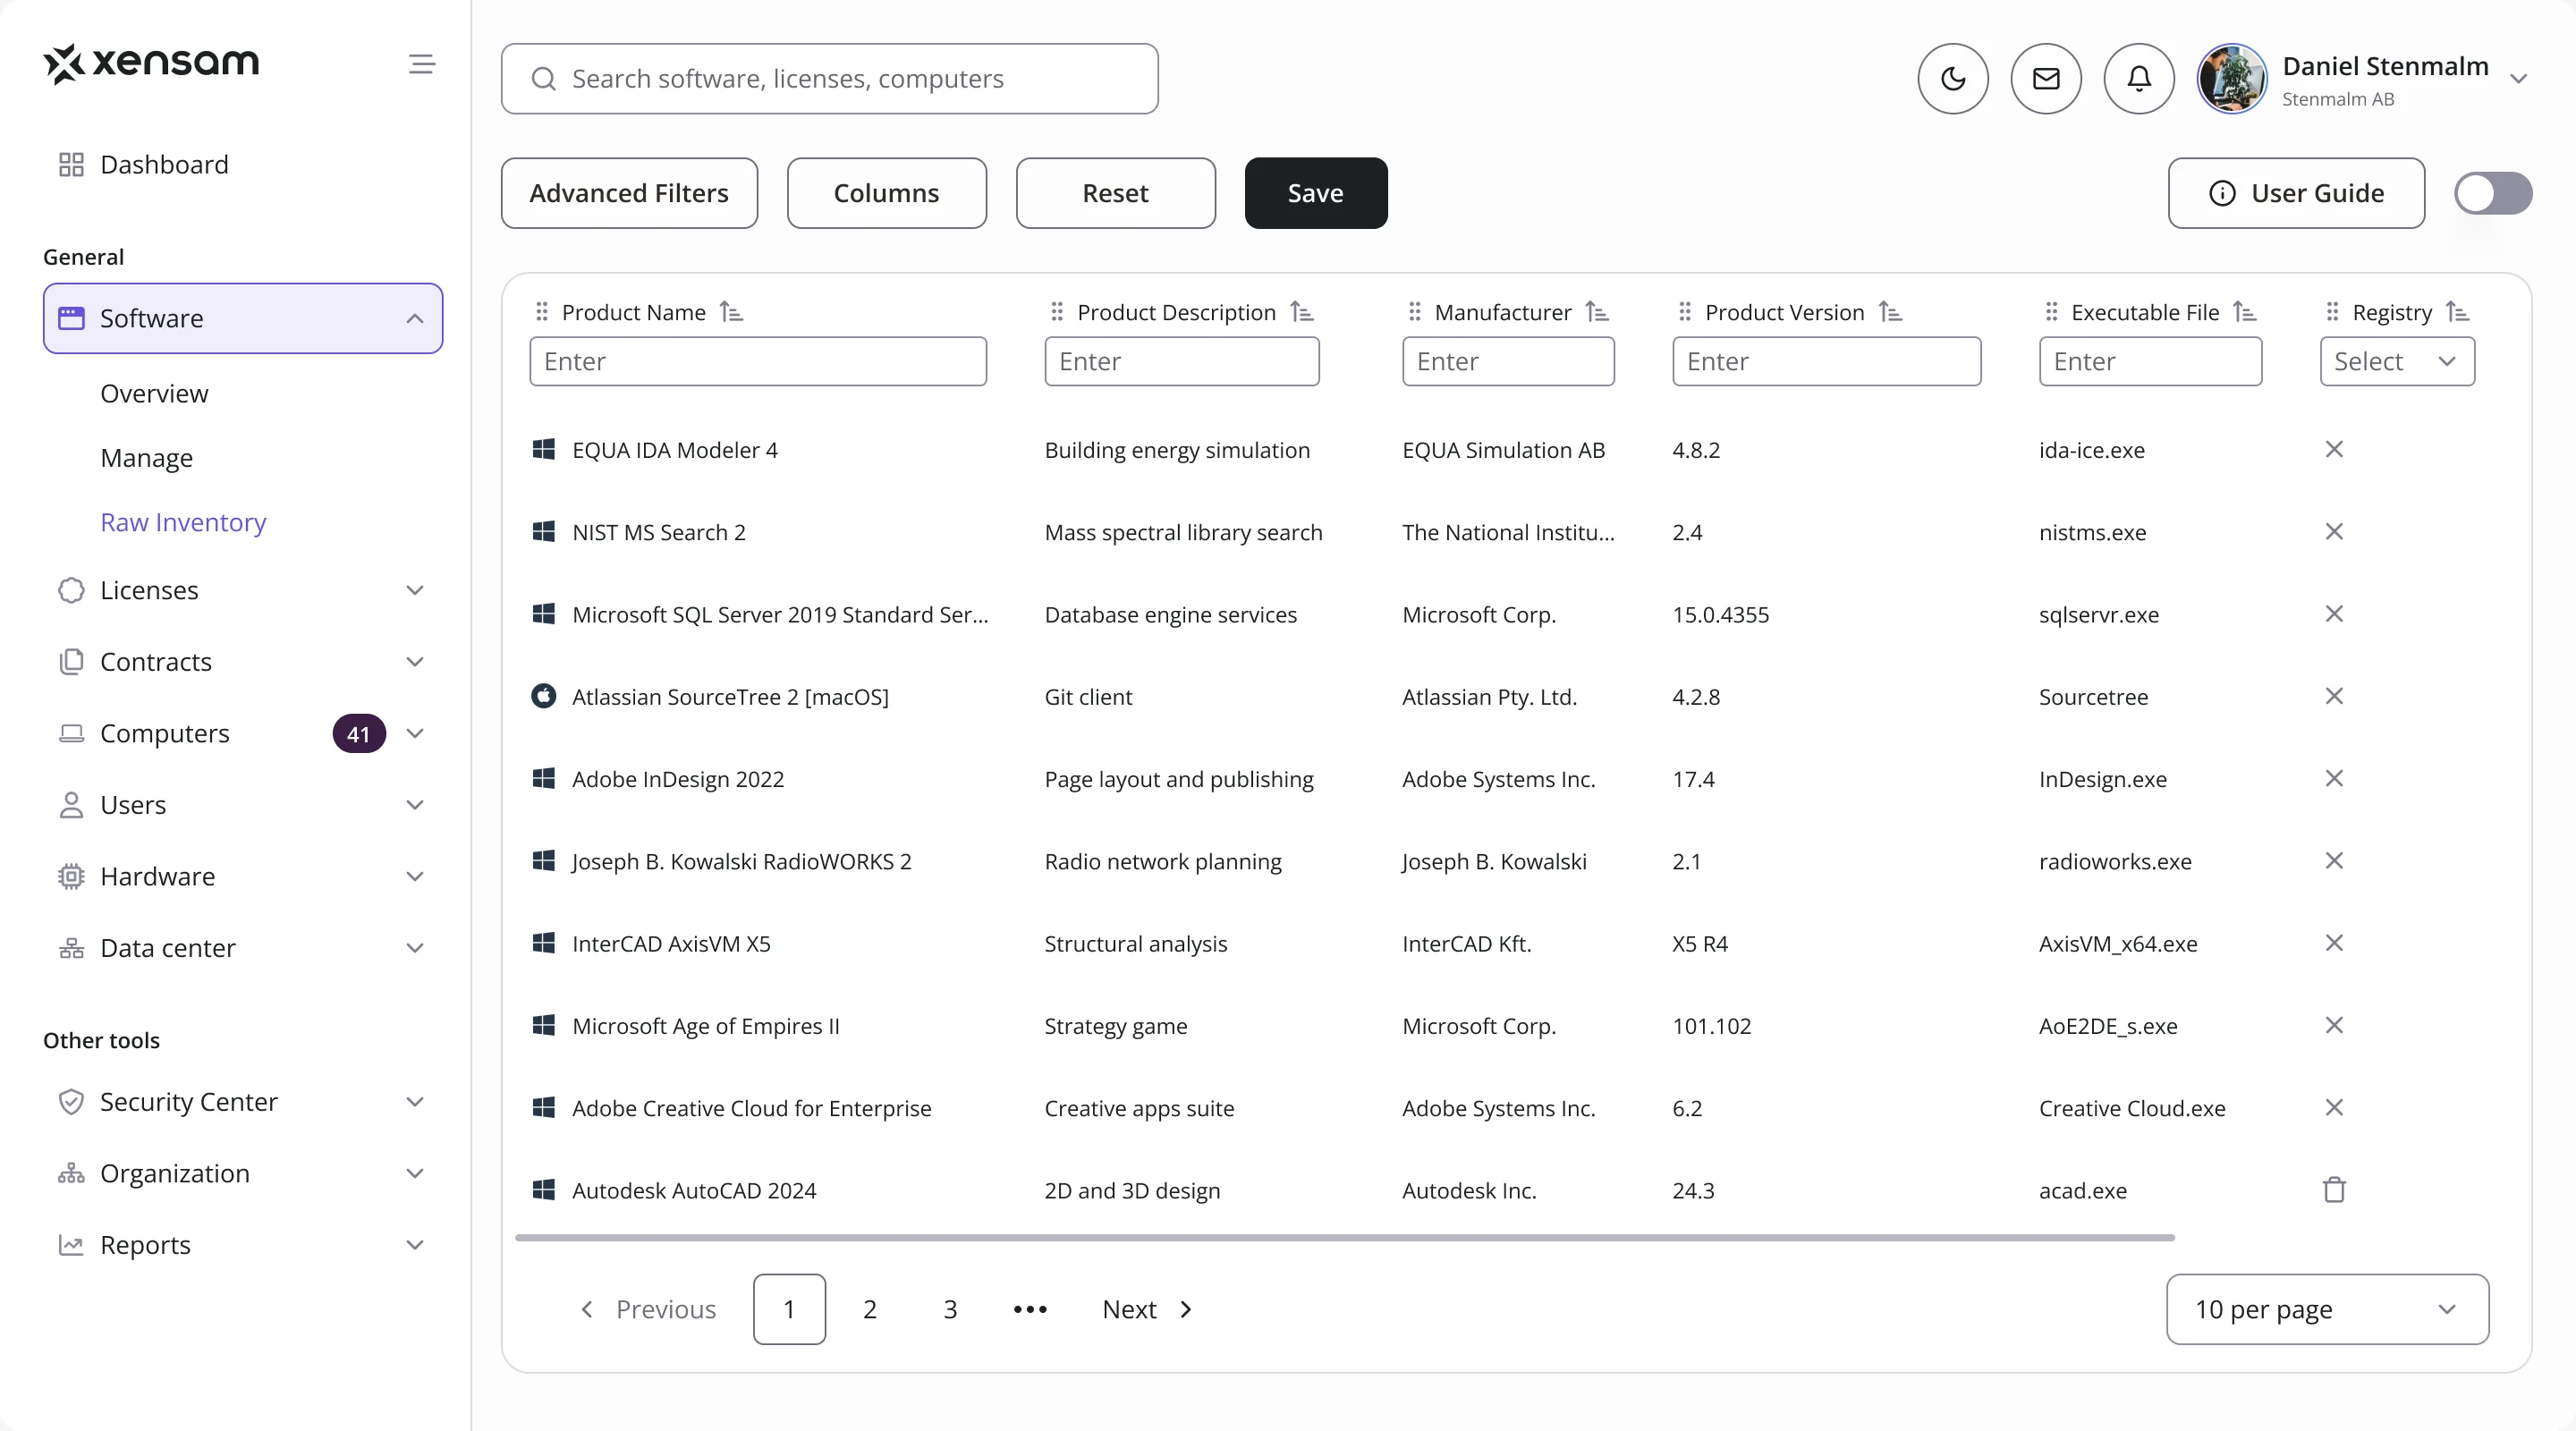
- Installed software arrives as thousands of raw records, and a license manager needs the applications behind them, who makes them and whether they need a license.
- Decided
- Three levels of the same data: an overview of trends and costs, a managed inventory of applications with their installations, and the raw records with the executable each one came from.
Knowing where licenses stand
- Found
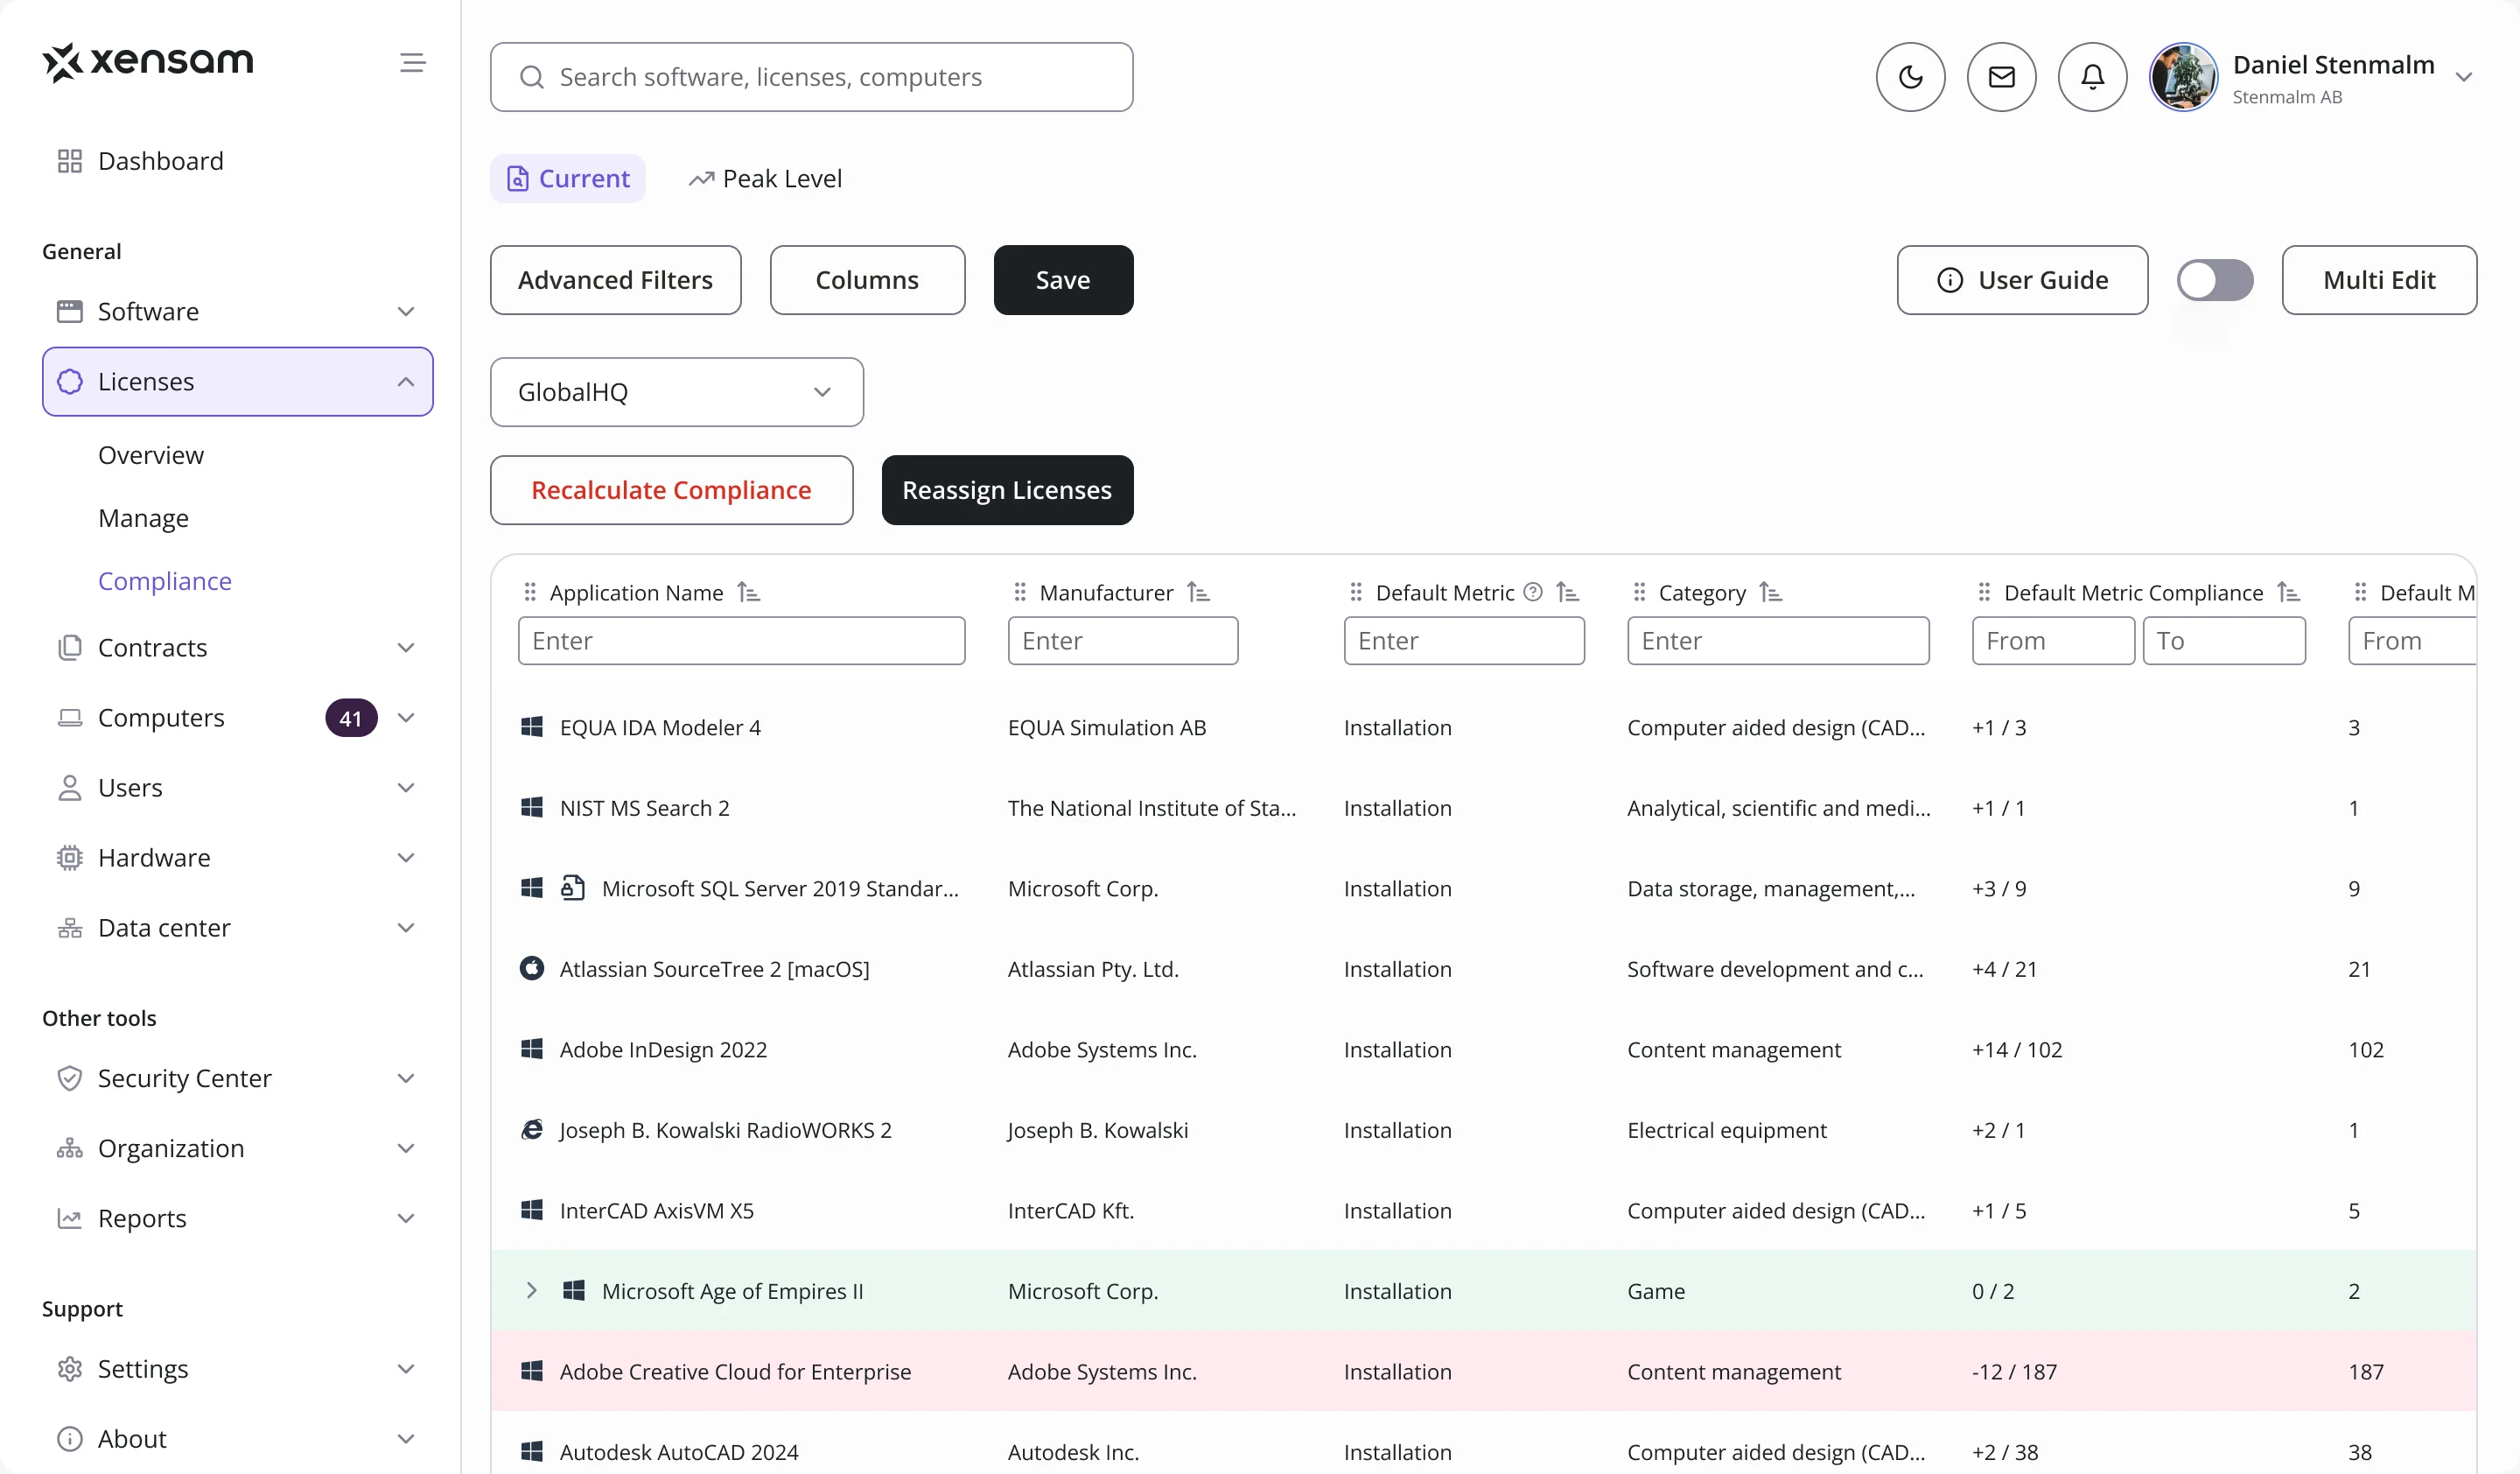
- A license position is a number per application and metric, and a long table of them hides the few that are short.
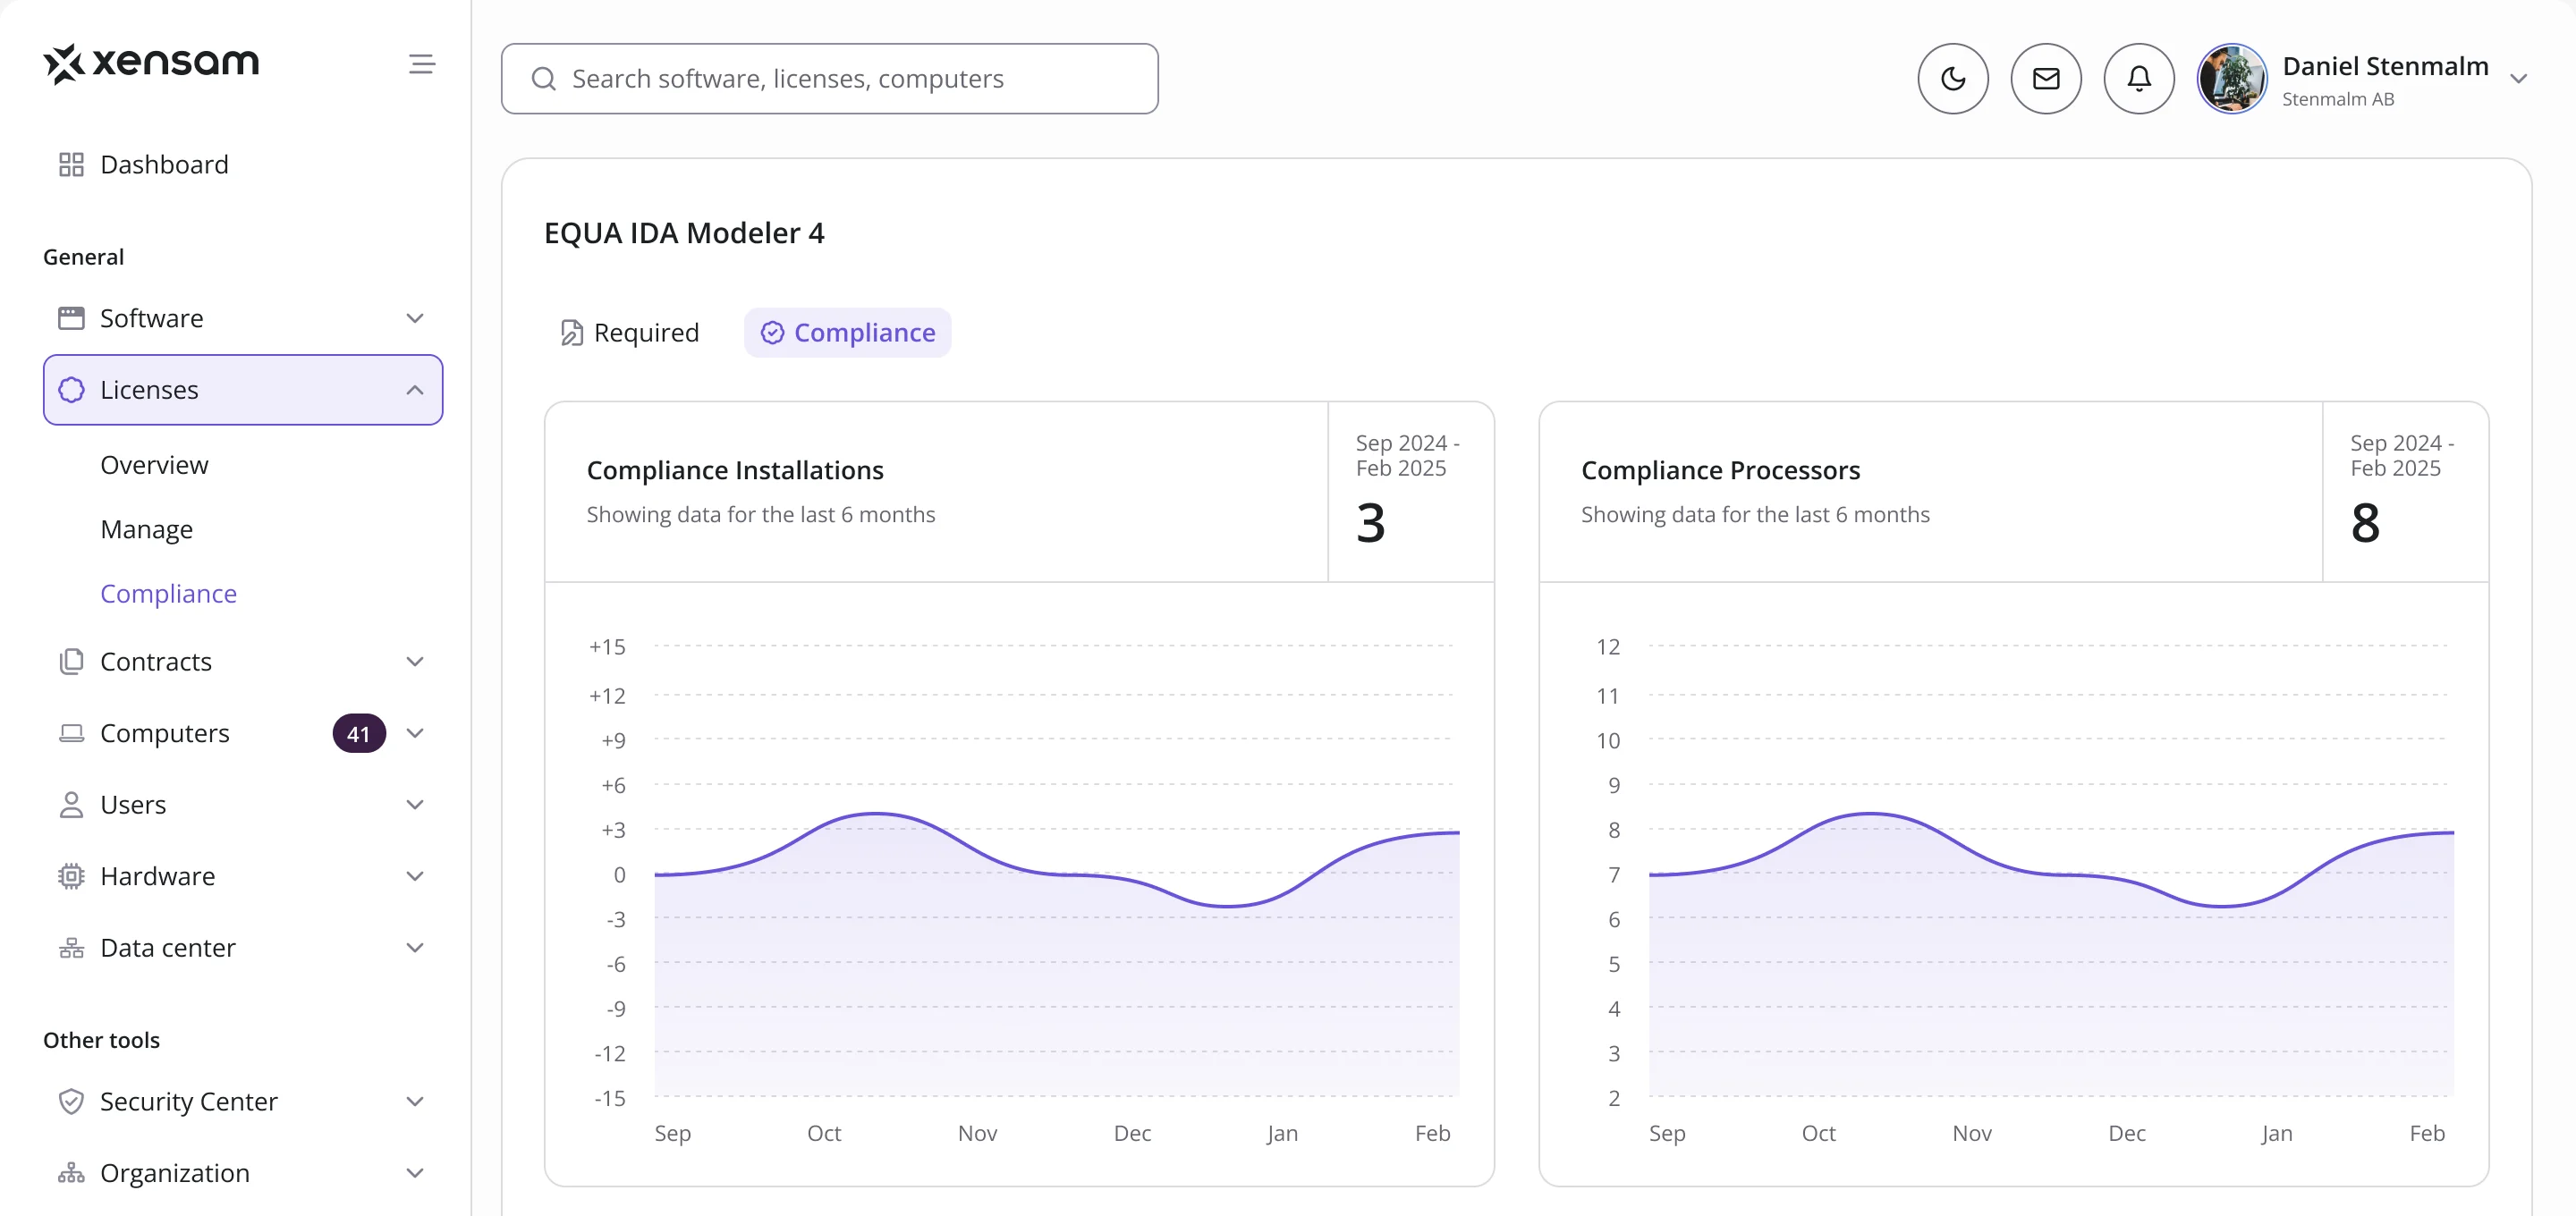
- Decided
- Compliance as a table that marks each row by its state, a surplus or a shortfall against what is required, with the history of any application a click away, metric by metric.
One record per license
- Found
- What was bought, under which contract, until when and for which applications sat in different places.
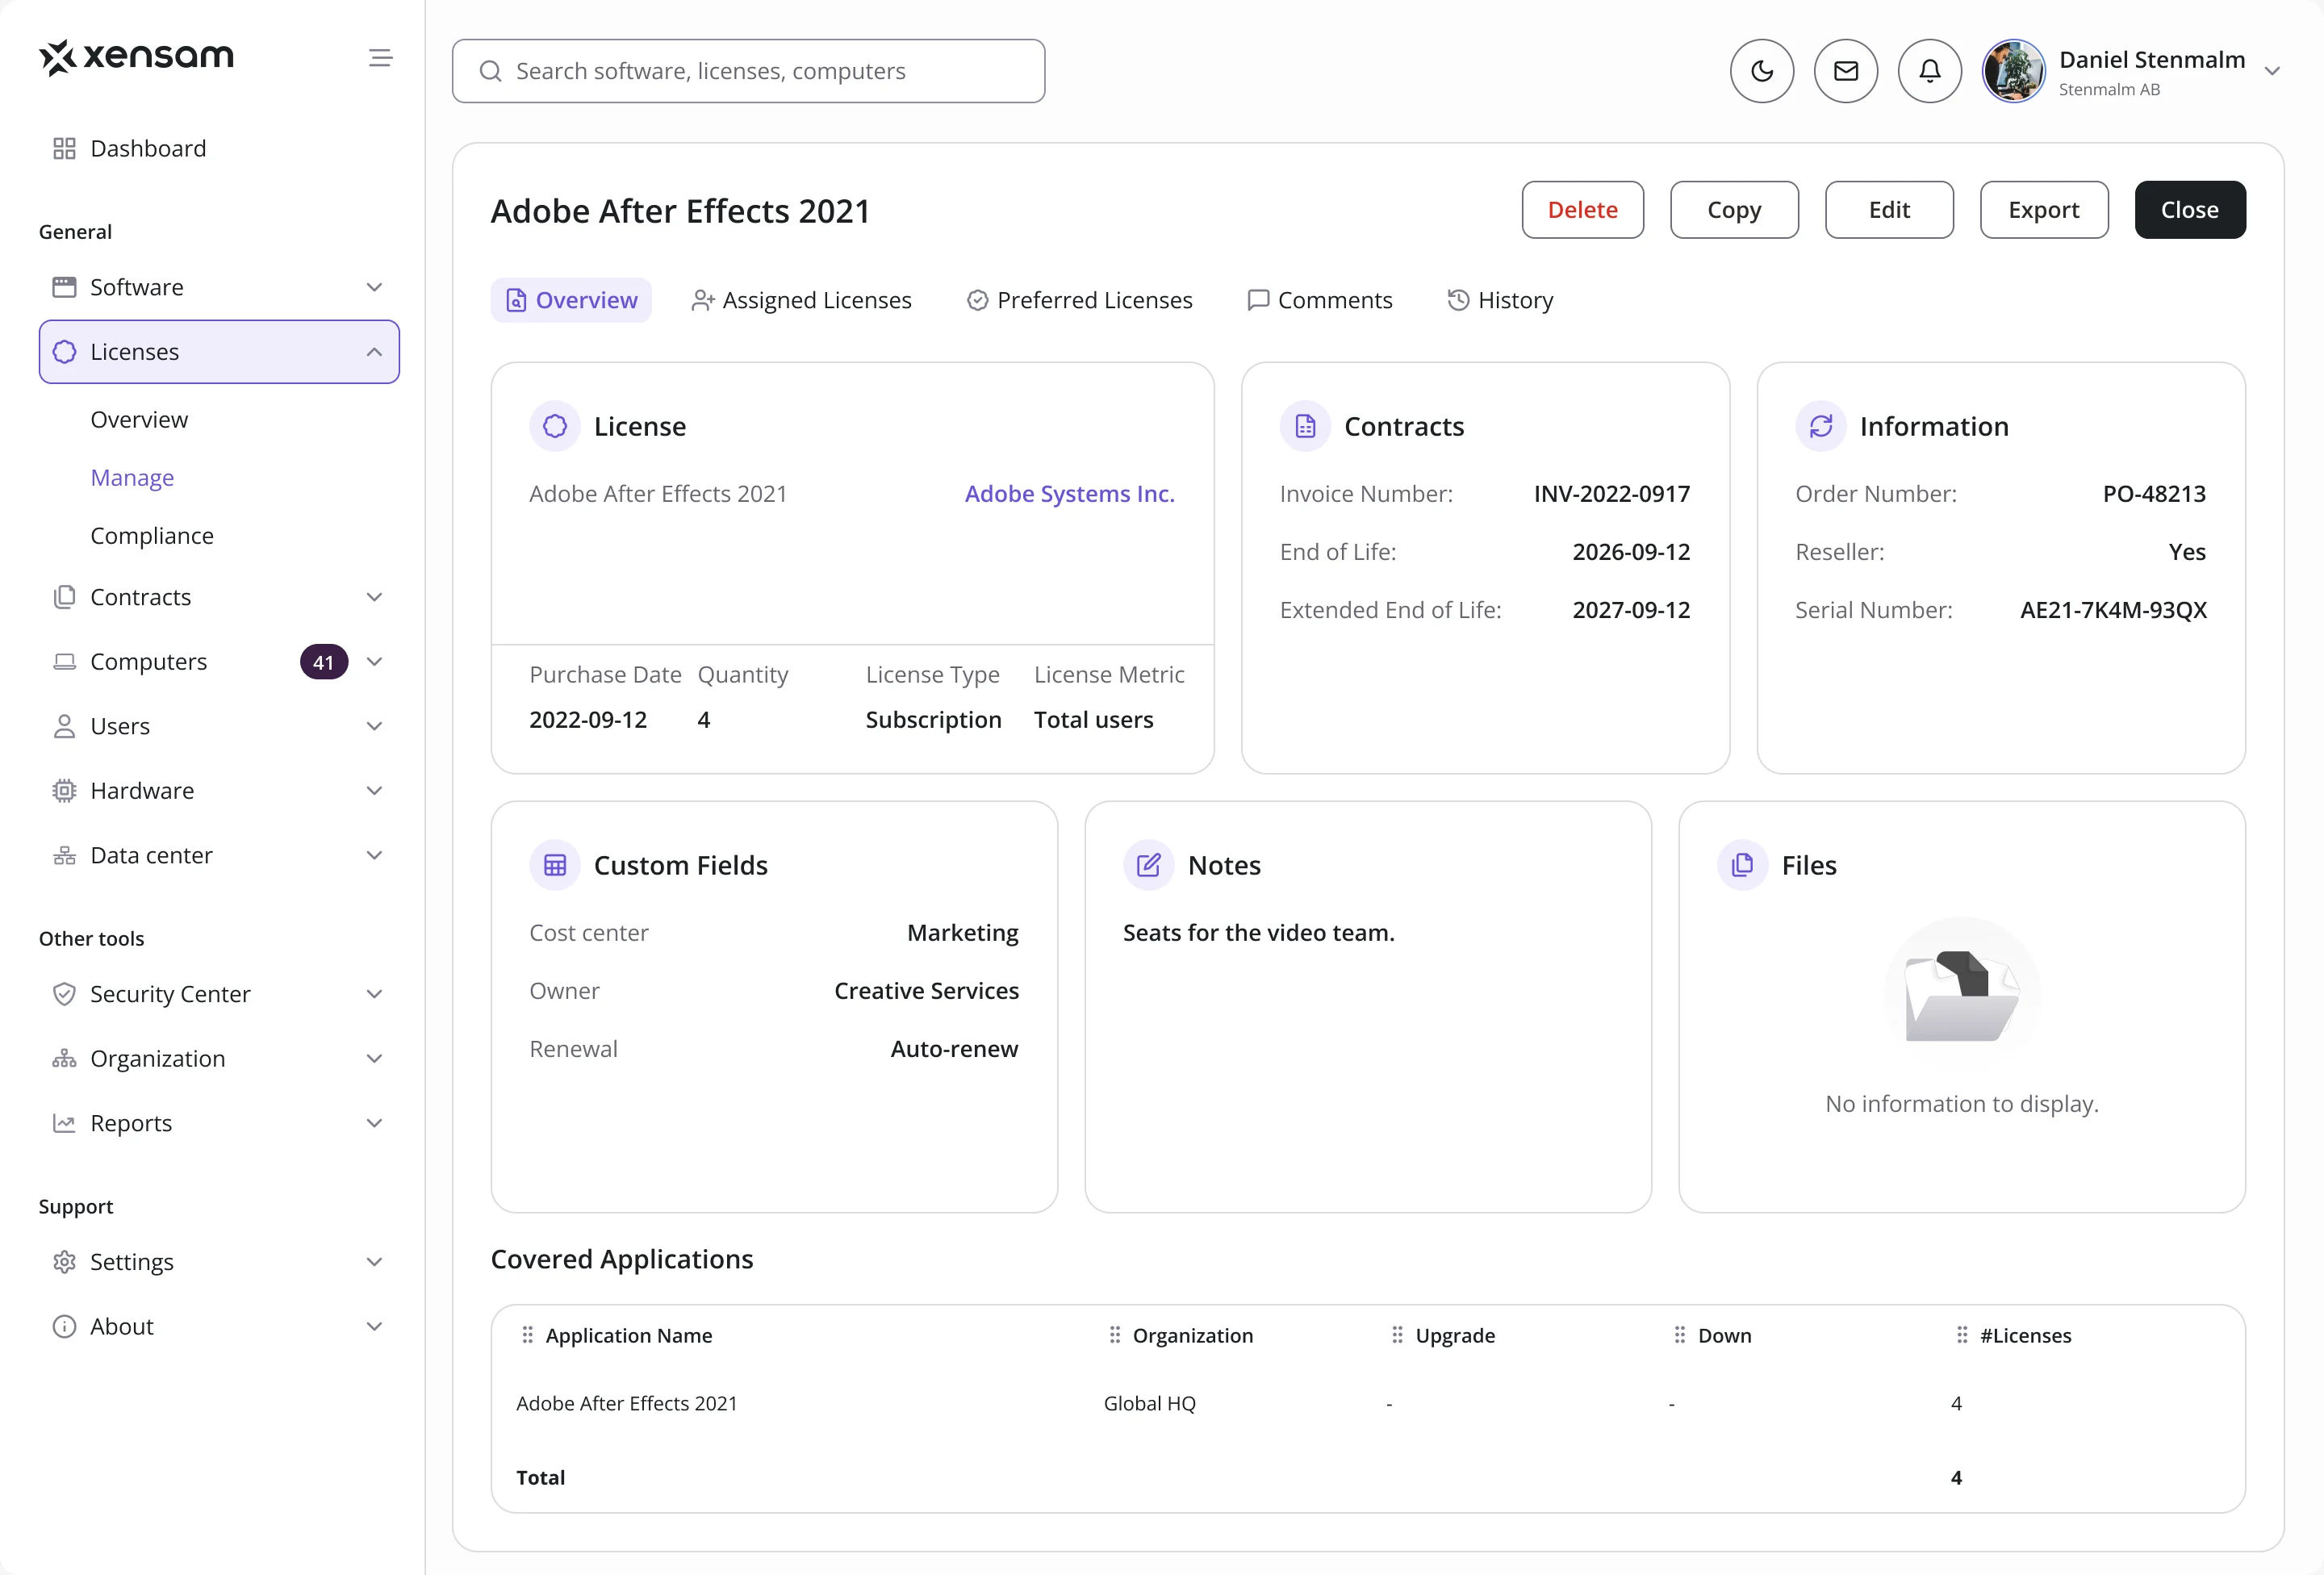
- Decided
- A license record that holds it all in one view: the license and its metric, the contract and end of life, order details, custom fields, notes, files and the applications it covers, with assignments, comments and history in tabs.
Hardware and data centers in the same logic
- Found
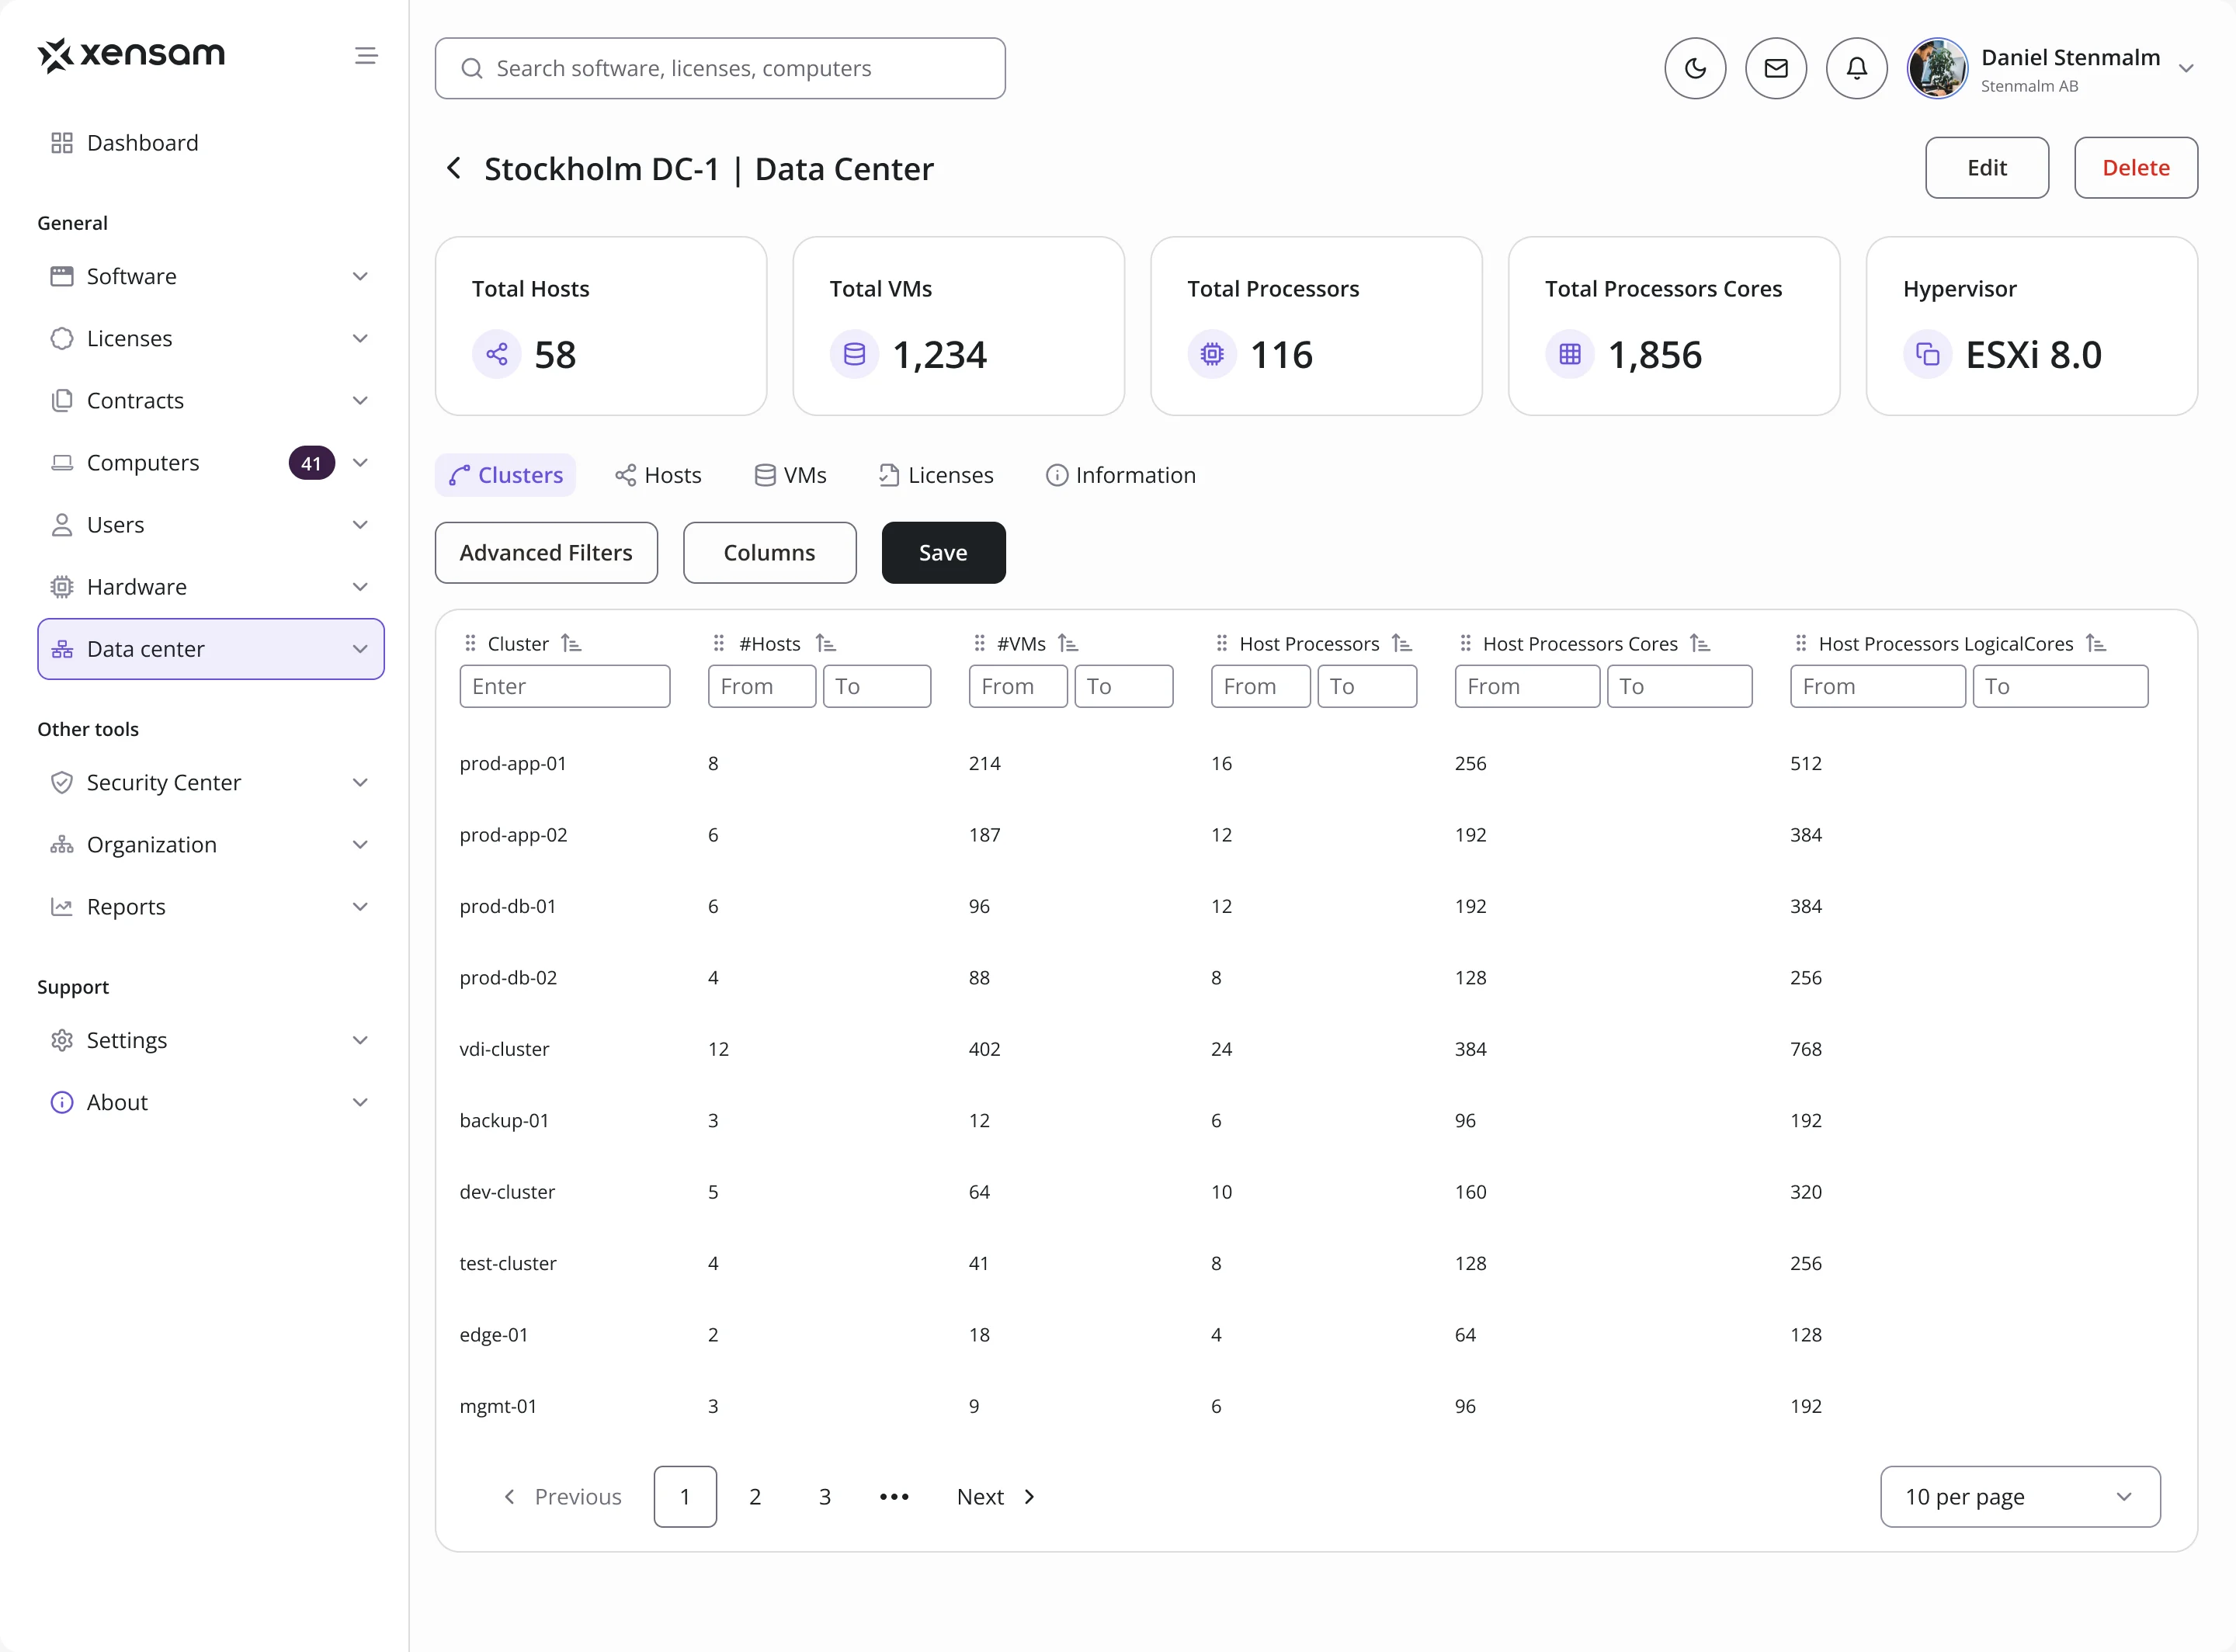
- Devices and data centers were managed in screens of their own, with their own way of filtering and reading.
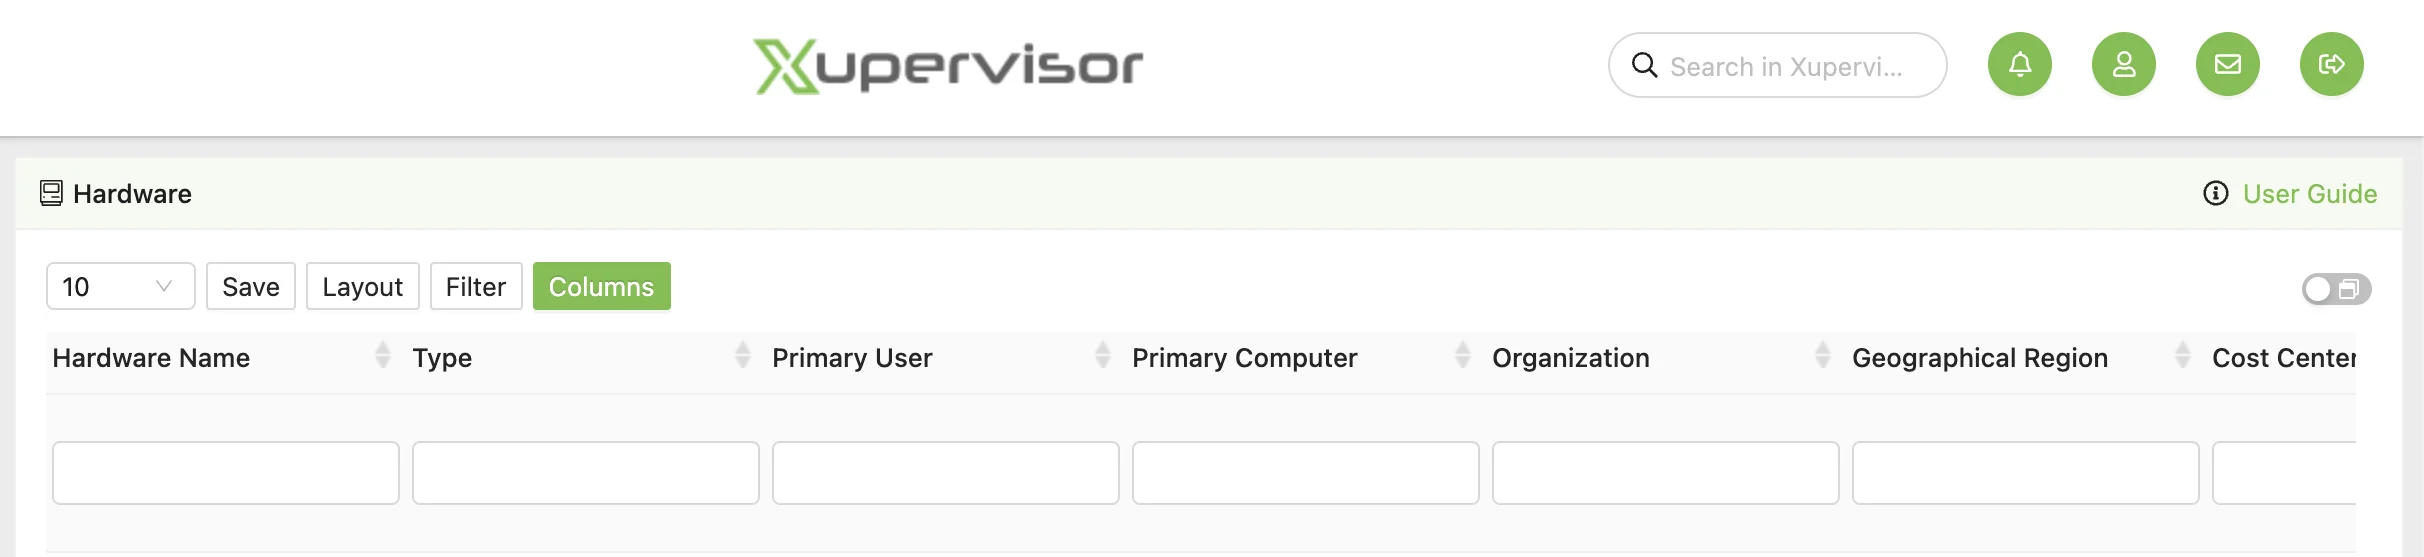
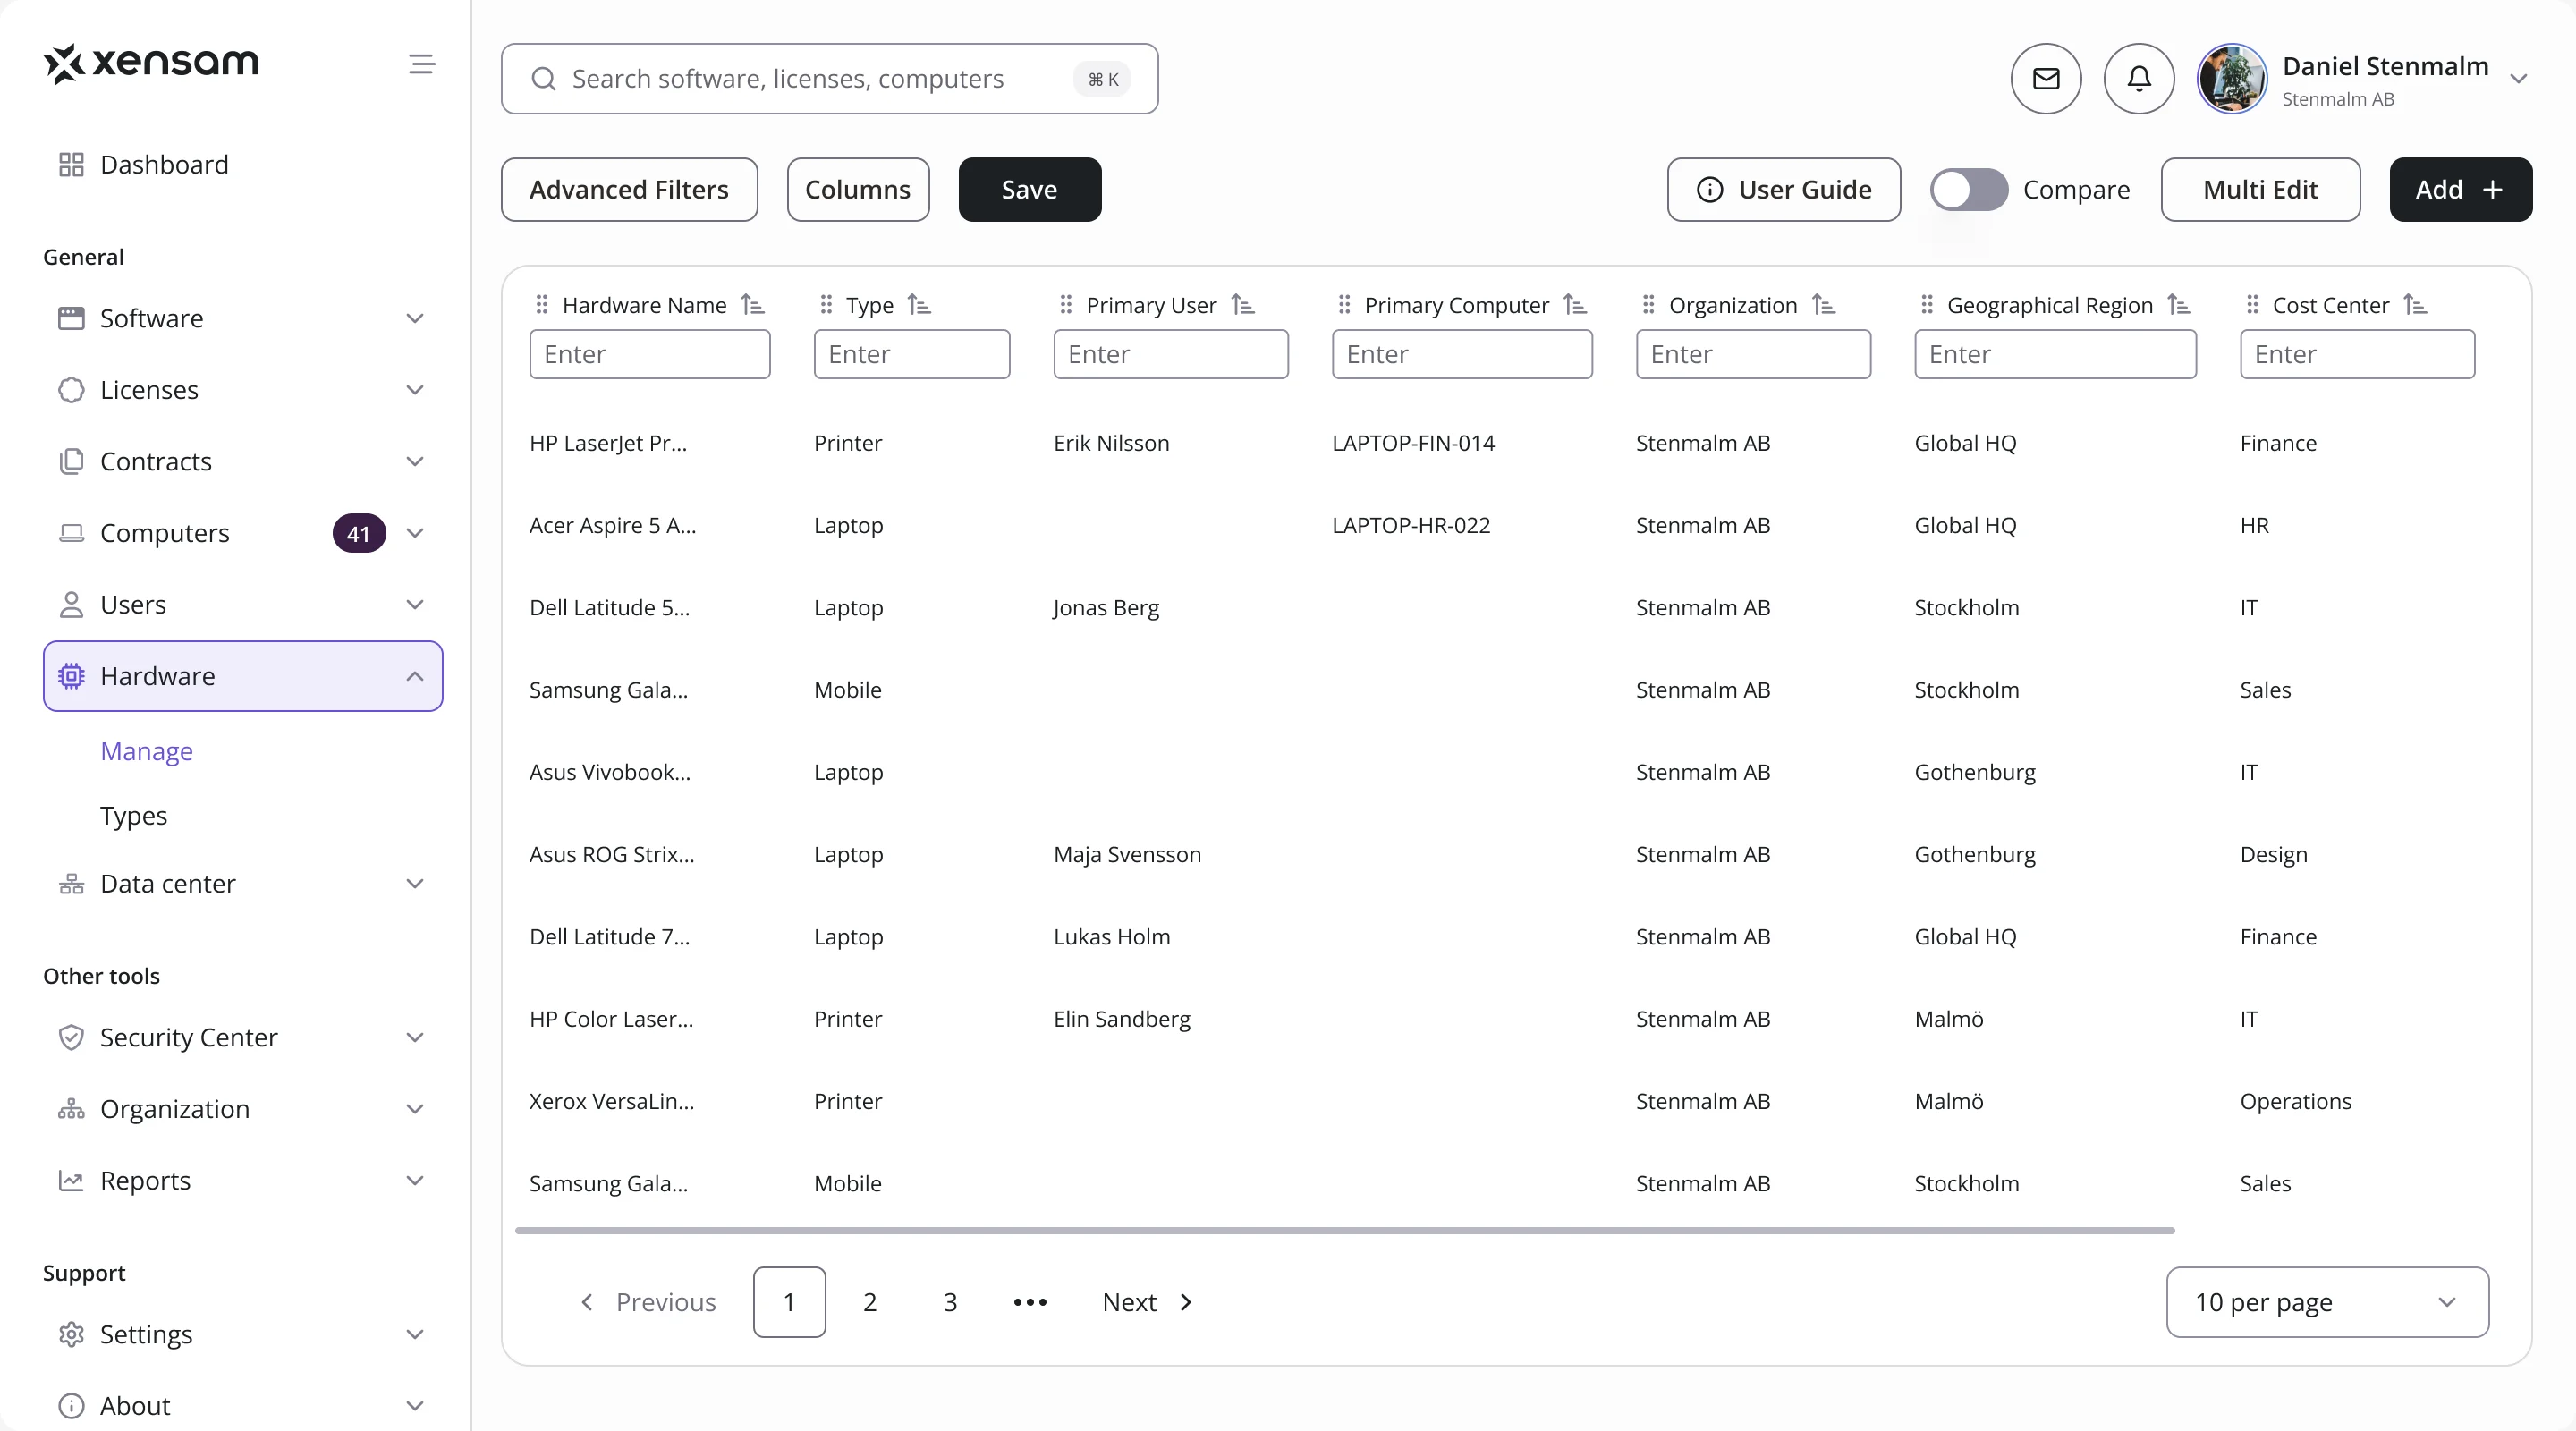
- Decided
- The same table pattern as software and licenses, extended to devices and to the clusters, hosts and VMs of each data center, with the totals on top.
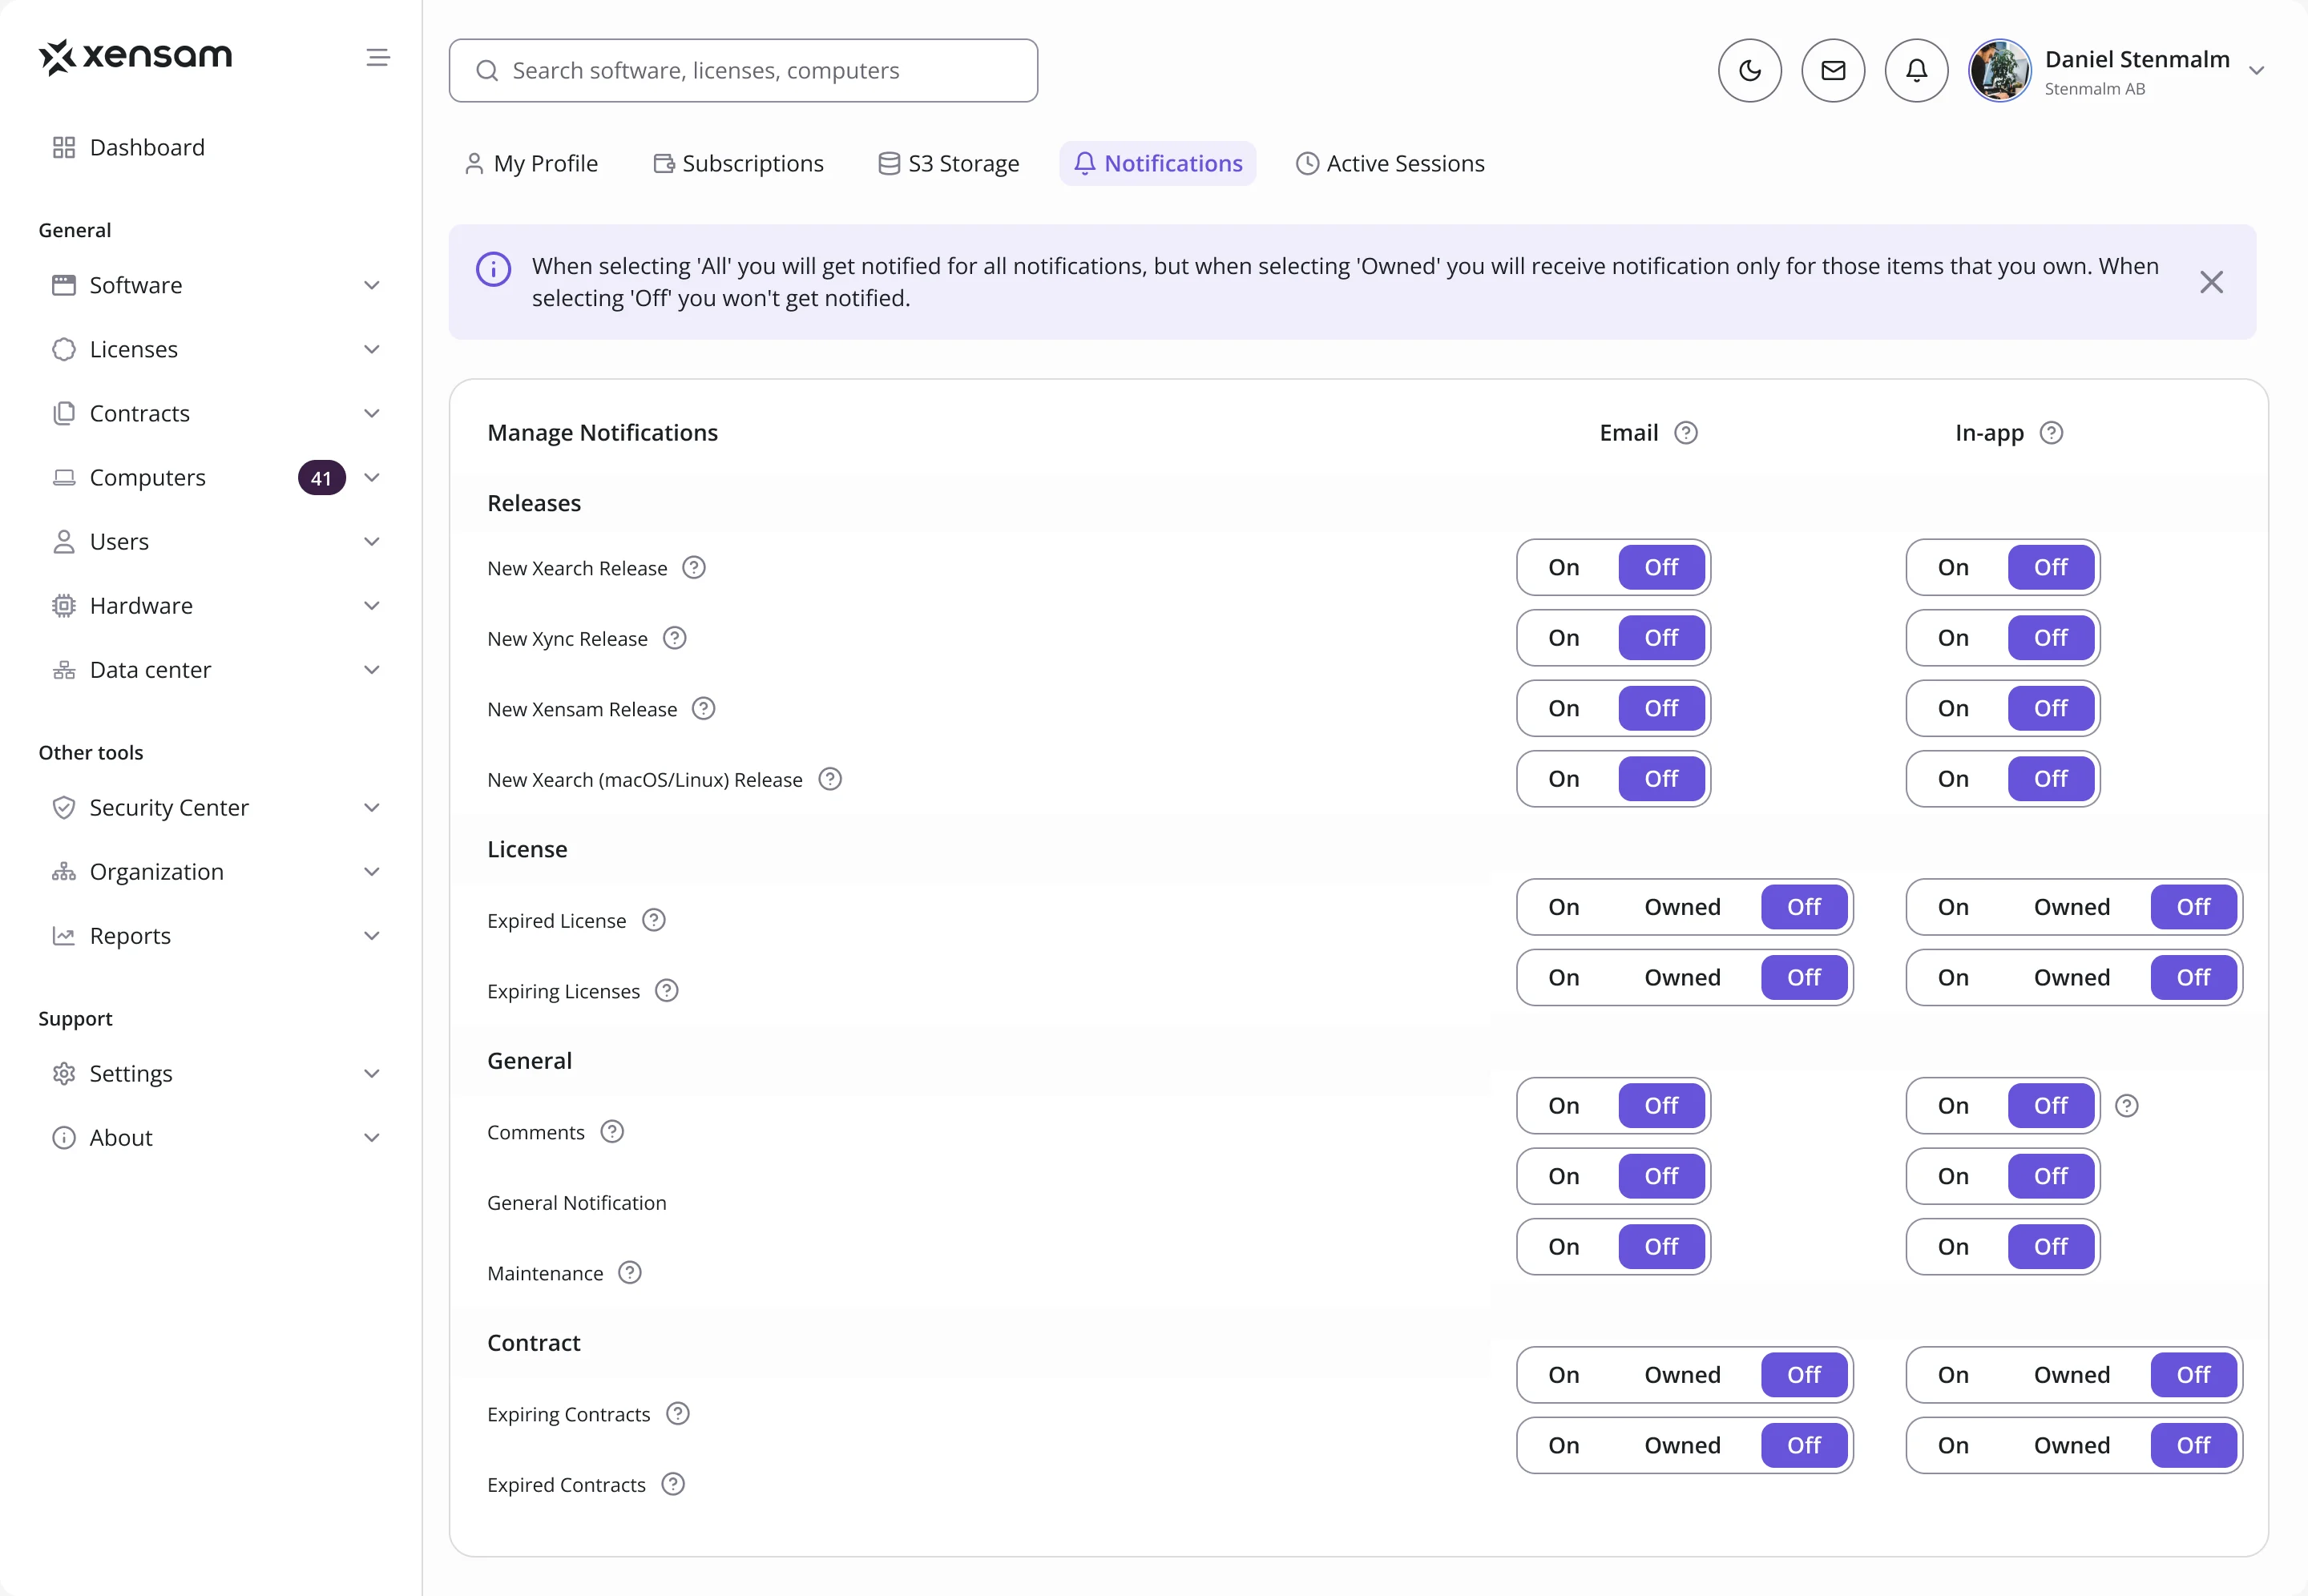
Notifications people can tune
- Found
- Releases, expiring licenses, contracts and comments all want attention, and one switch for everything means people switch it all off.
- Decided
- Each notification set by channel, email or in-app, and for licenses and contracts only for the items a person owns.
One design system under every module
- Found
- Dashboards, charts, tables, filters, forms and management modules all had to look and behave alike, without anything drawn twice.
- Decided
- A full design system from the foundations up: colour, type, tokens and variables, light and dark themes, and a component library planned one-to-one with shadcn-style code so developers could build it in Tailwind CSS.
One header on every screen
Search, theme, messages, notifications and the profile in the same place in every module, each drawn for every state it can be in.
-
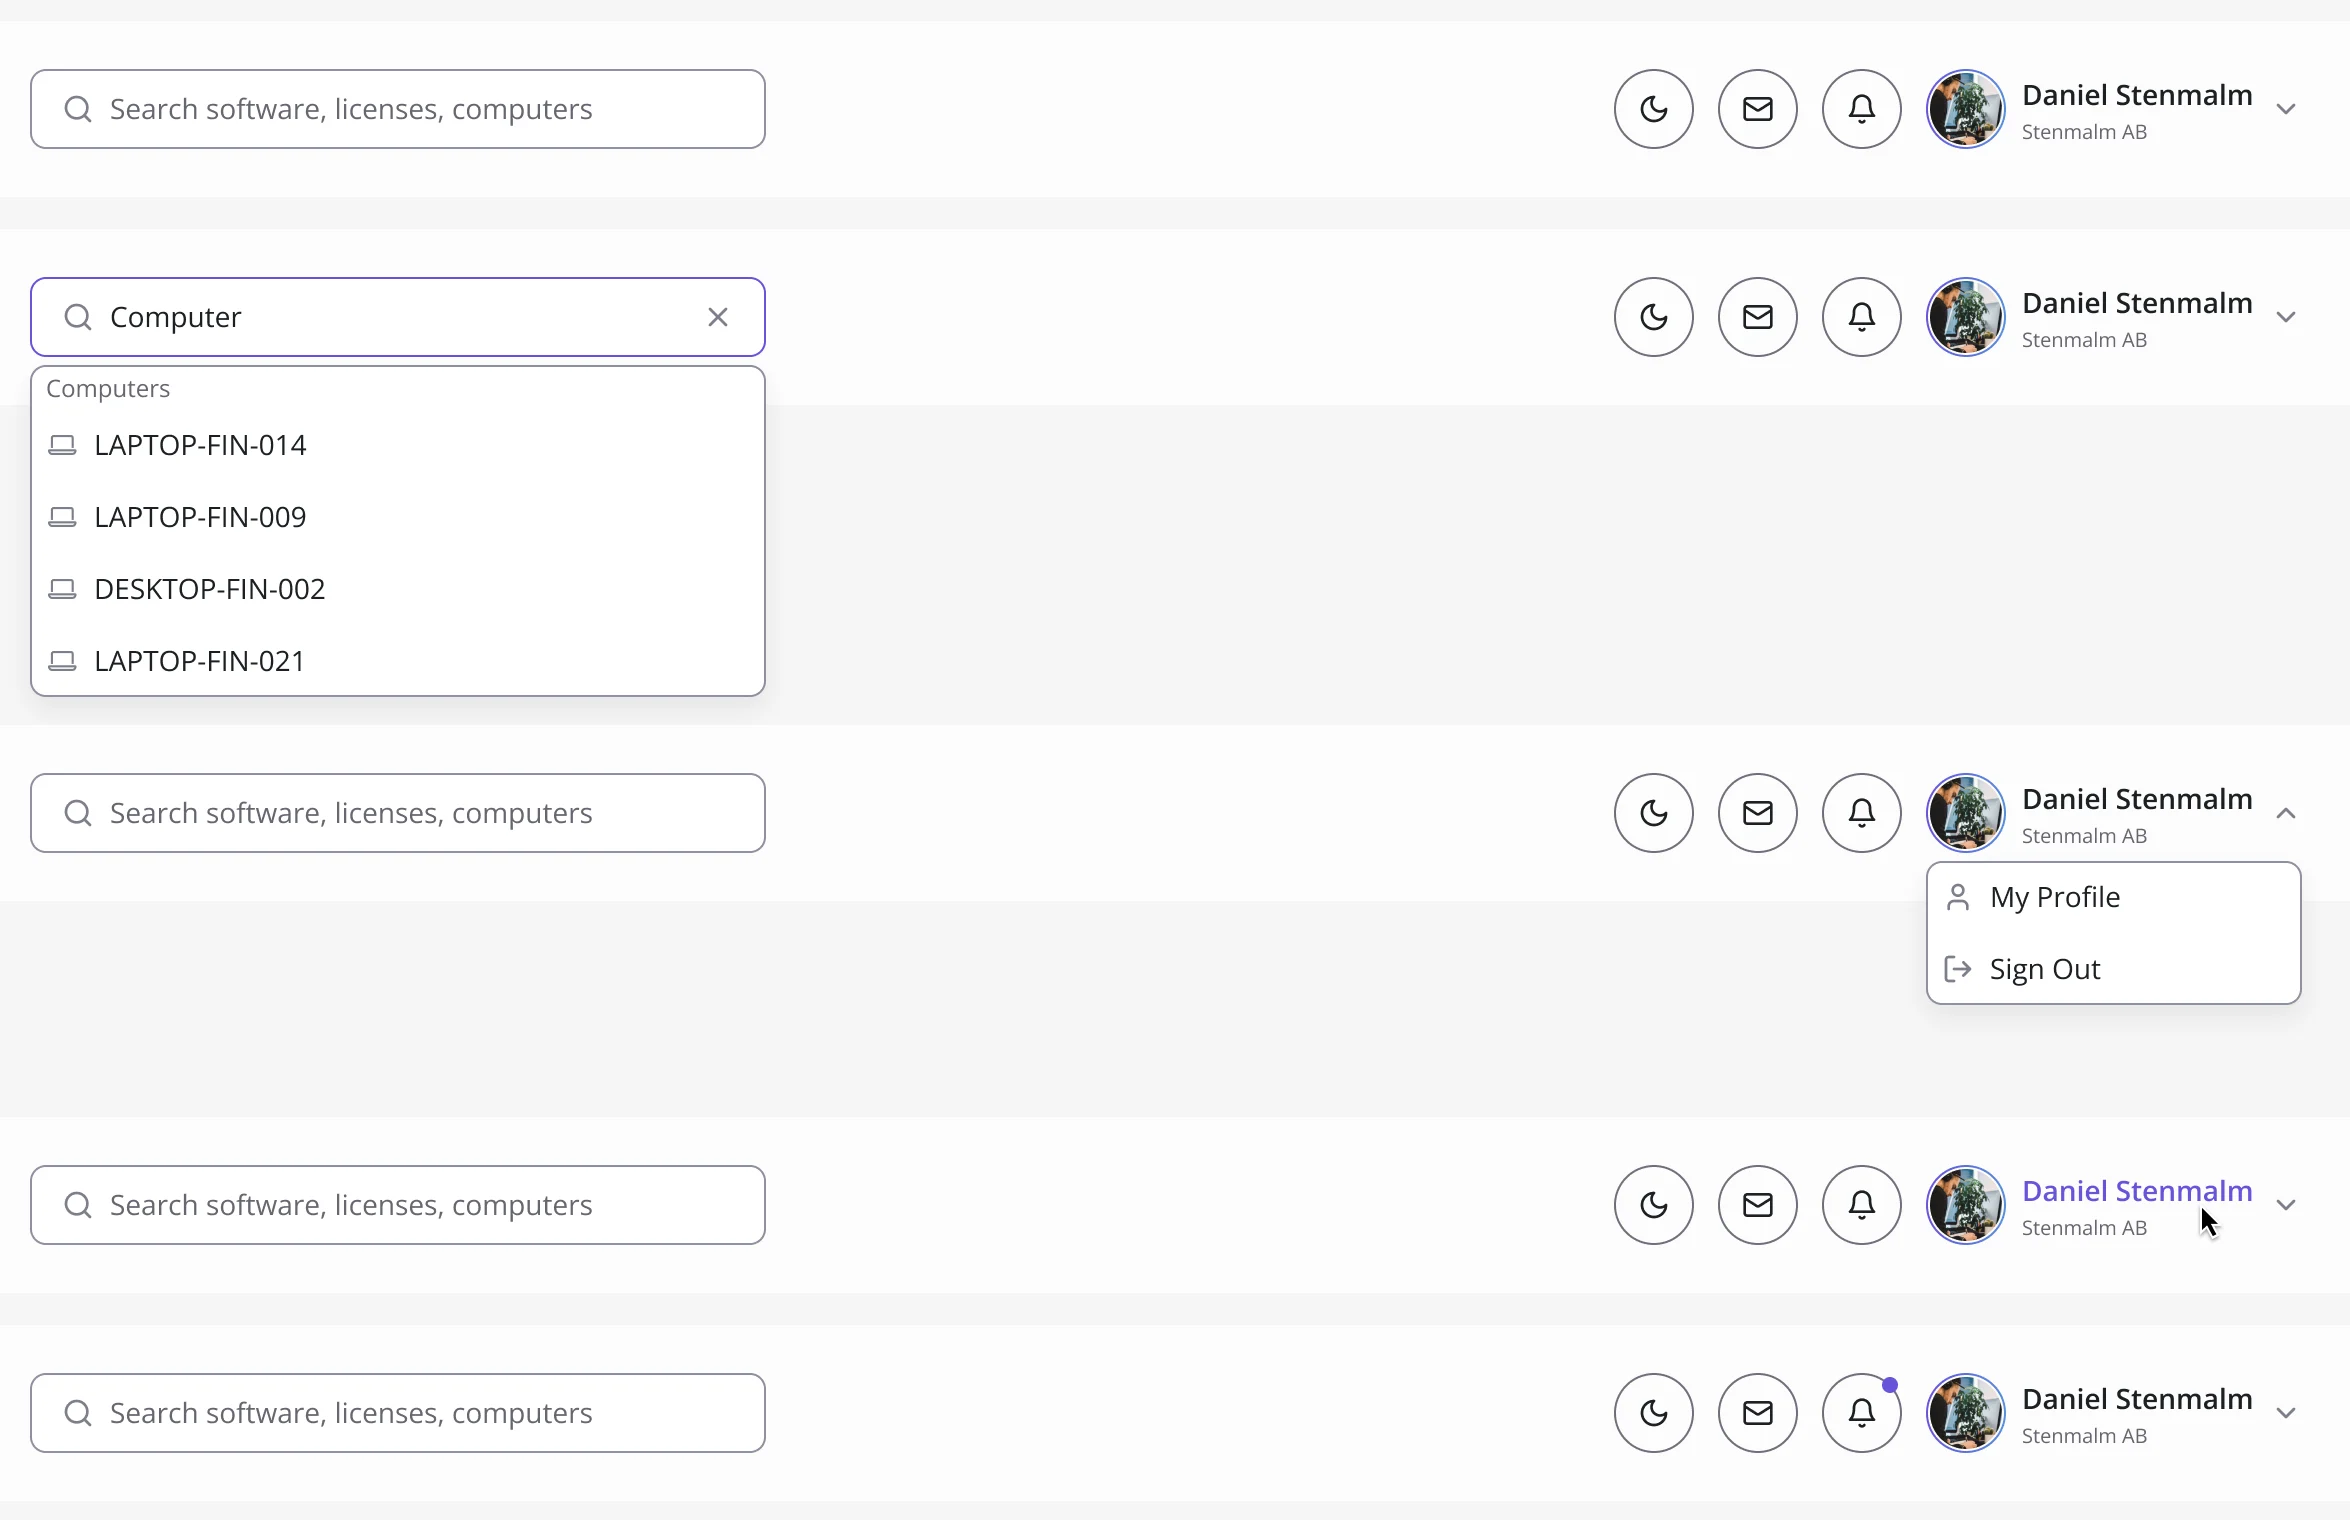
Header: At rest, searching, with the profile menu open, under the pointer and with a new notification.
One menu item, every state
The same Software item at rest, under the pointer and selected.
-

Default, hover, selected
Where the platform ended up
Xensam’s core desktop product redesigned and handed off in full: software, licenses, hardware, data centers, reports and the account under one menu and one set of components, for Viewer and Admin, in light and dark, with a design system, a clickable prototype and a Tailwind CSS handoff.
We designed it; development was not part of our scope.
- roles, Viewer and Admin, with full screen parity
- 2
- themes across the product
- Light + dark
- web application
- Desktop
- CSS handoff, shadcn-aligned components
- Tailwind

Is your product too specialist to hand over?
License metrics, compliance positions, clusters and VMs: we designed Xensam around the work its specialists already do. Bring us your platform, and we’ll learn its domain before we redraw it.
More work like this
Three more dense B2B products we redesigned.
-
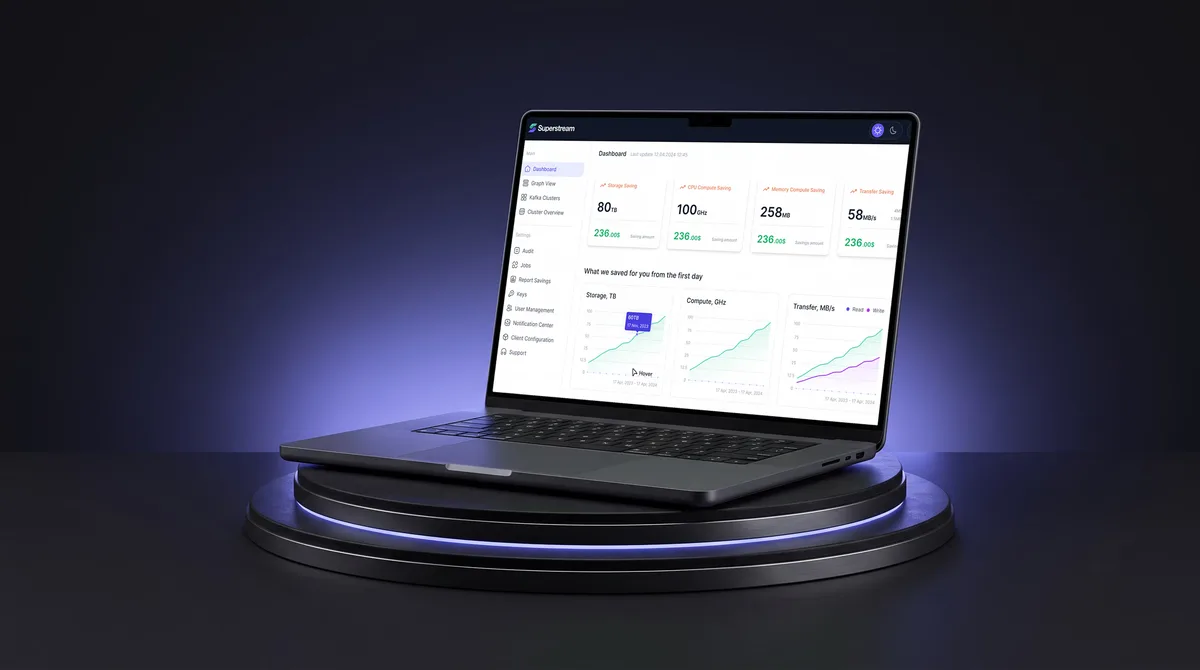
AI Hi-Tech · SaaS
Superstream
Made a Kafka management platform’s technical data readable for DevOps teams, in light and dark.
- 3000+ Screens designed
- 1500h+ Design hours
-
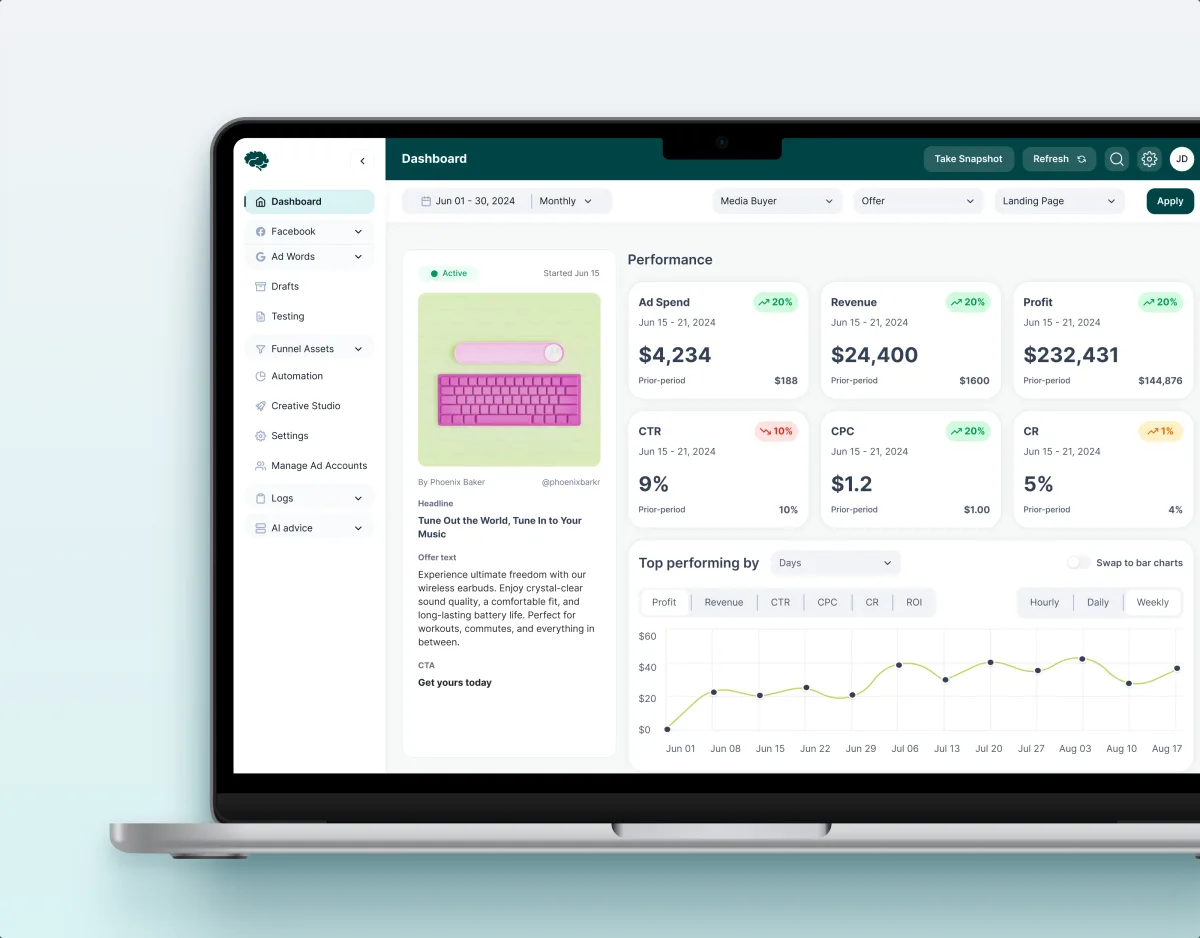
MarTech · Ads analytics · Web SaaS
Concussion Media
Rebuilt a paid-traffic analytics SaaS around the numbers its media buyers act on.
- 400+ Screens and states
- 11 Modules designed and approved by the client
-
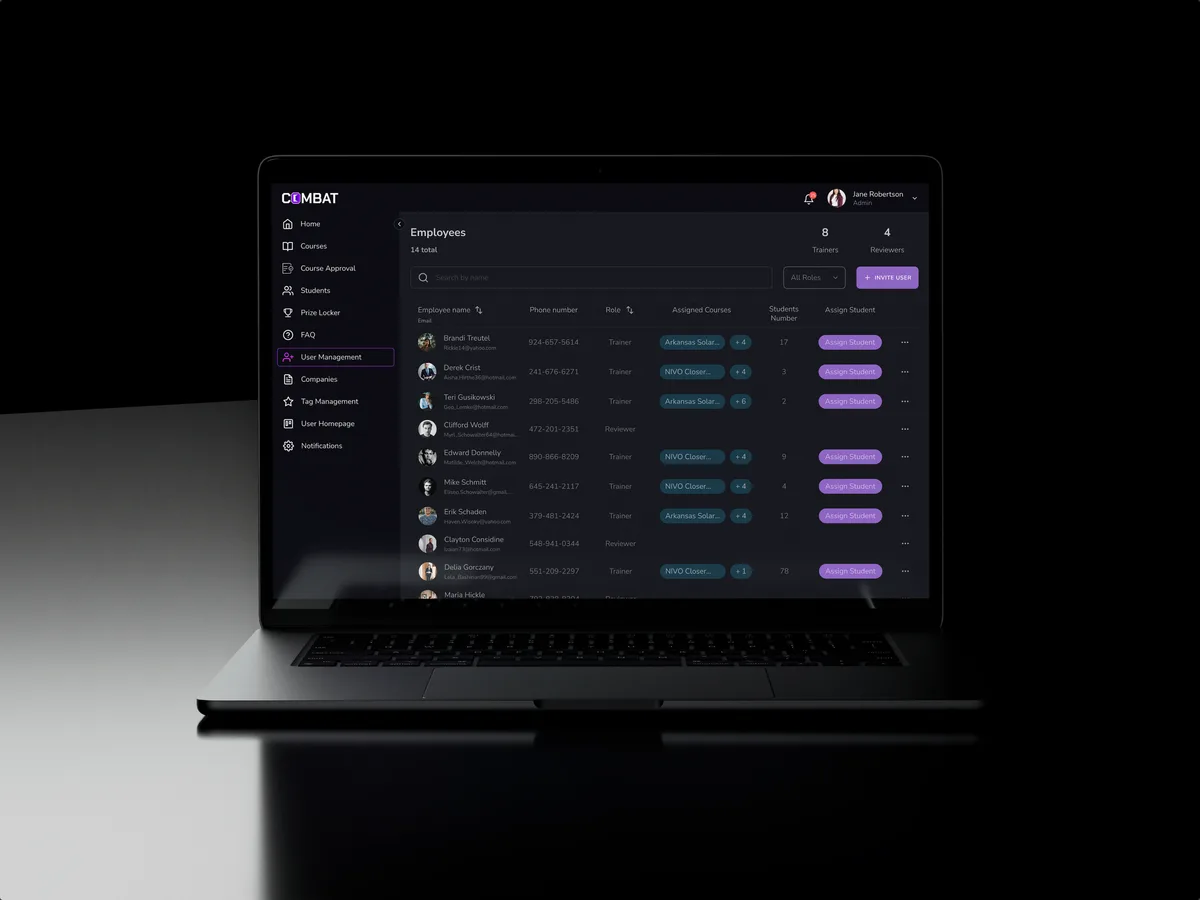
Sales training · Desktop web platform
Combat Sales
Reworked a live sales-training platform for five roles without making its users start over.
- 80+ Final desktop screens and interaction states
- 5 Roles in one platform