
Marketing analytics that answers back
Performance, funnels, leads, automation rules, creative approval and campaign setup, redesigned as one system a media buyer can read.
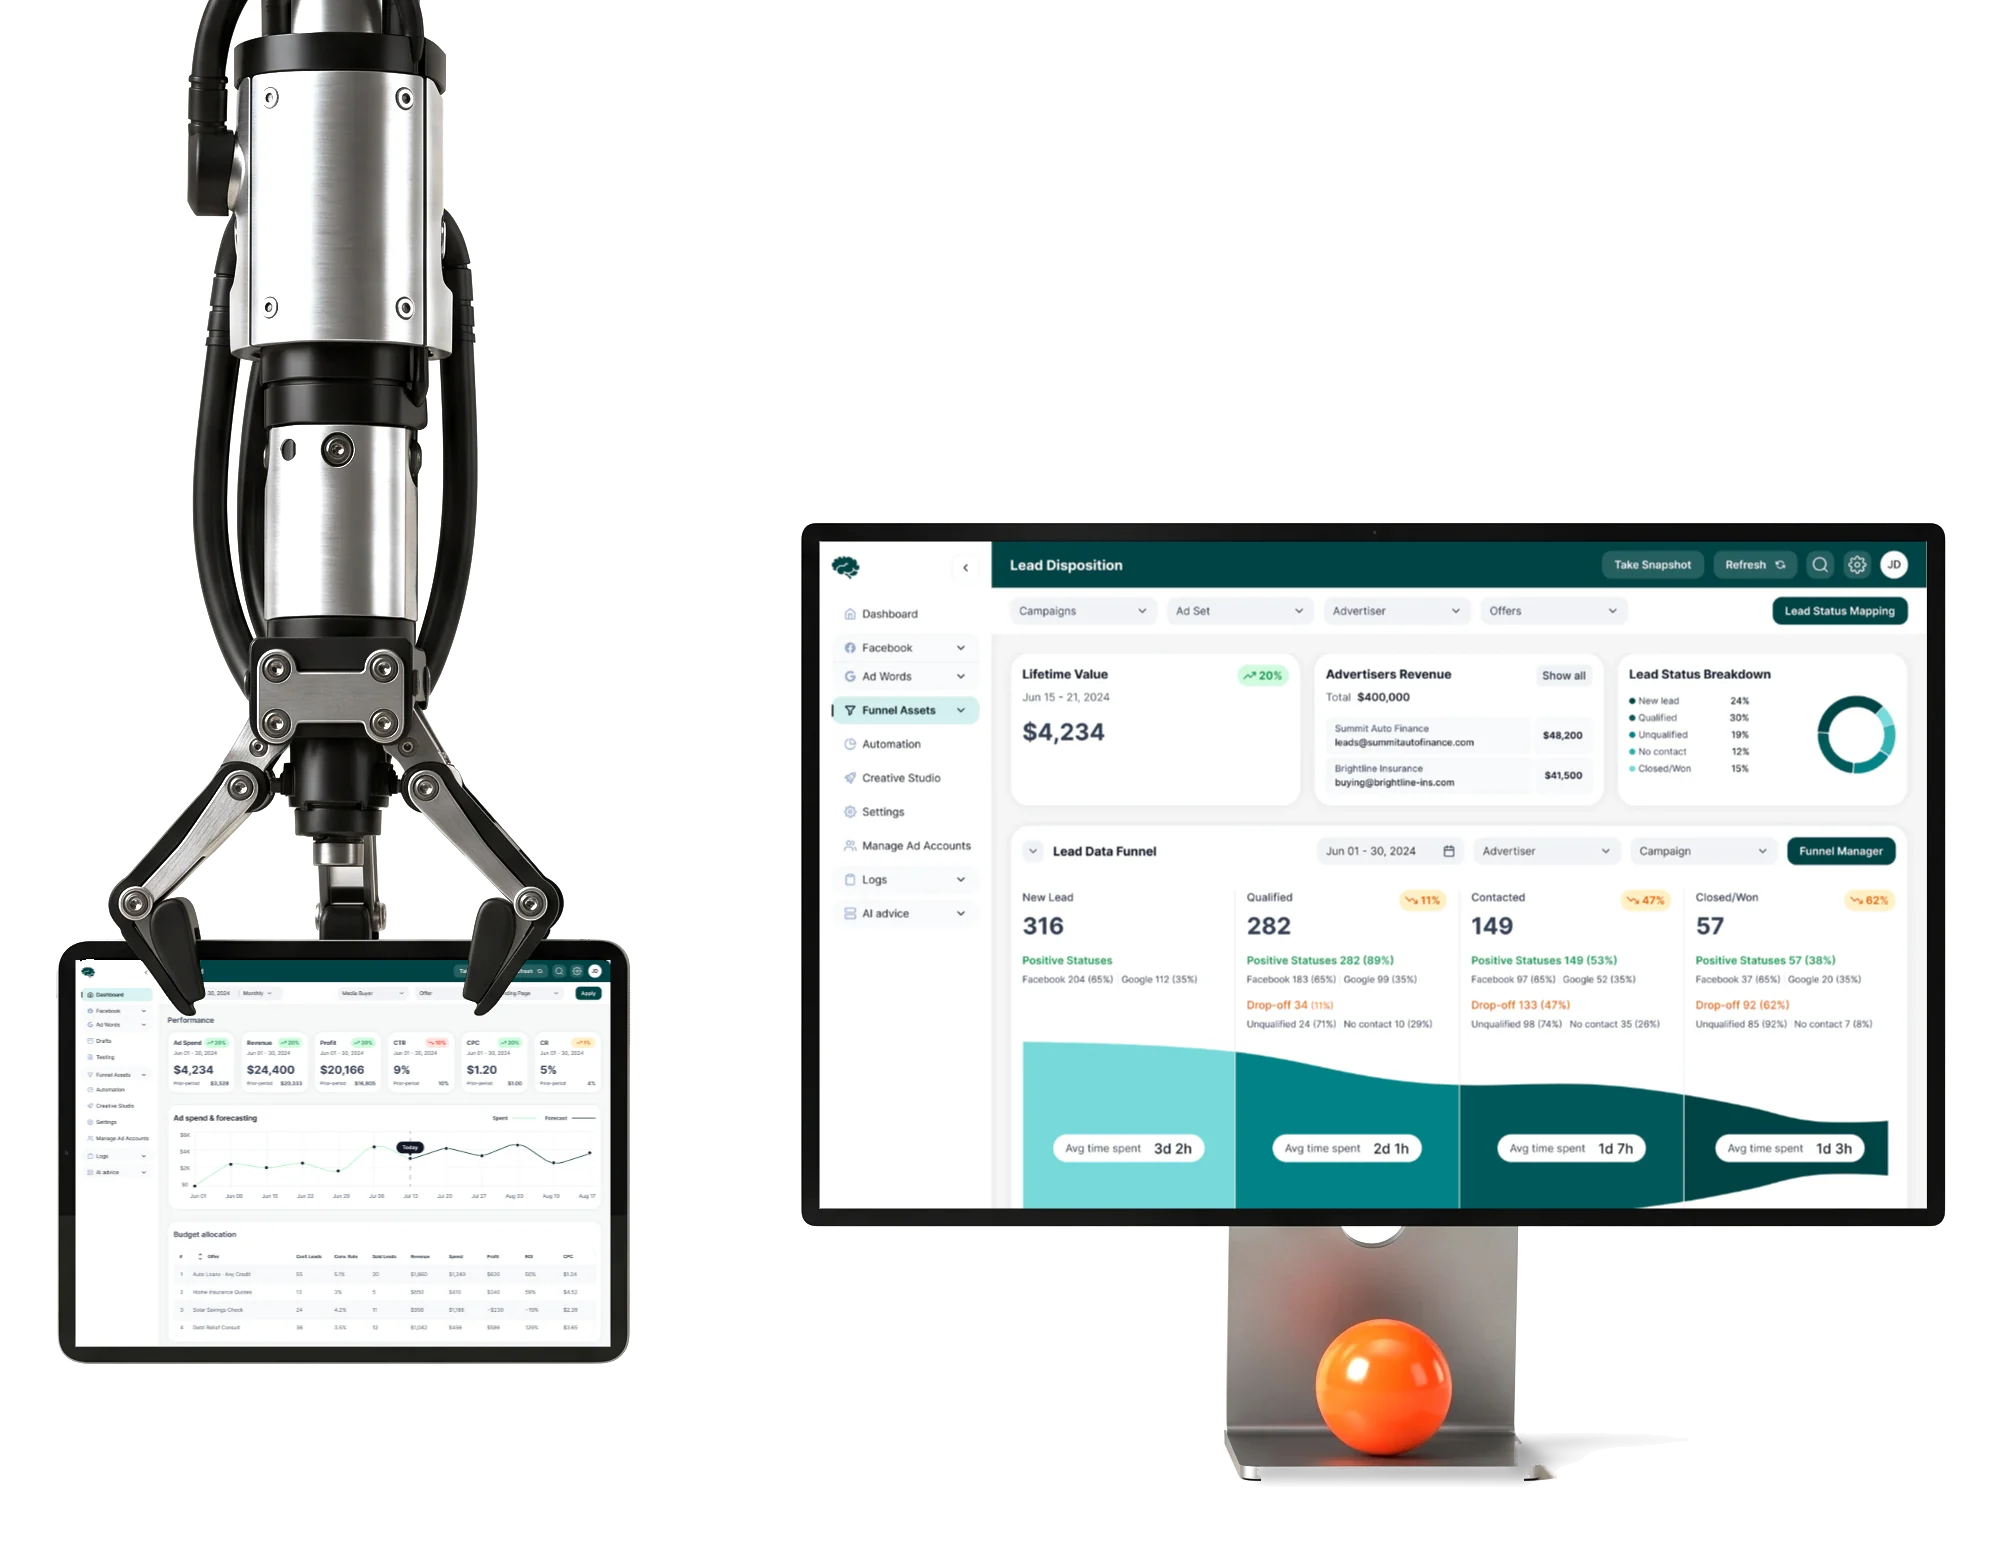
- 400+
- screens and states, designed across the product
- 11
- modules designed and approved by the client
- 4
- experts from the ANODA team
Project summary
Concussion Media is a paid-traffic and marketing-analytics platform: media buyers and performance marketers use it to read campaign performance. We reviewed the live product, then designed 11 modules as one system — dashboards , funnels and lead disposition, rules, creative approval and campaign setup — across 400+ screens and states.
What a media buyer reads before moving money
A budget decision pulls from every part of the product. Its areas, in the order a buyer meets them:
-
Performance
- Spend and revenue
- Profit, CTR, CPC, CR
- Forecast
-
Audiences
- Age and gender
- Location
- Best days and hours
-
Creatives
- Top performers
- Review and approval
-
Funnels and leads
- Stage drop-off
- Attribution
- Postback log
-
Rules
- Triggers
- Actions
- Rule log
-
AI signals
- Trends
- Anomalies
- Advice
- Density and Clarity
- Every metric a buyer asks for, on a screen that still reads in seconds.
- Automation and Control
- Rules act on live campaigns; people see what fired, why, and can stop it.
- Demo data and Real data
- Every module drawn for empty, filtered-out and broken data too.
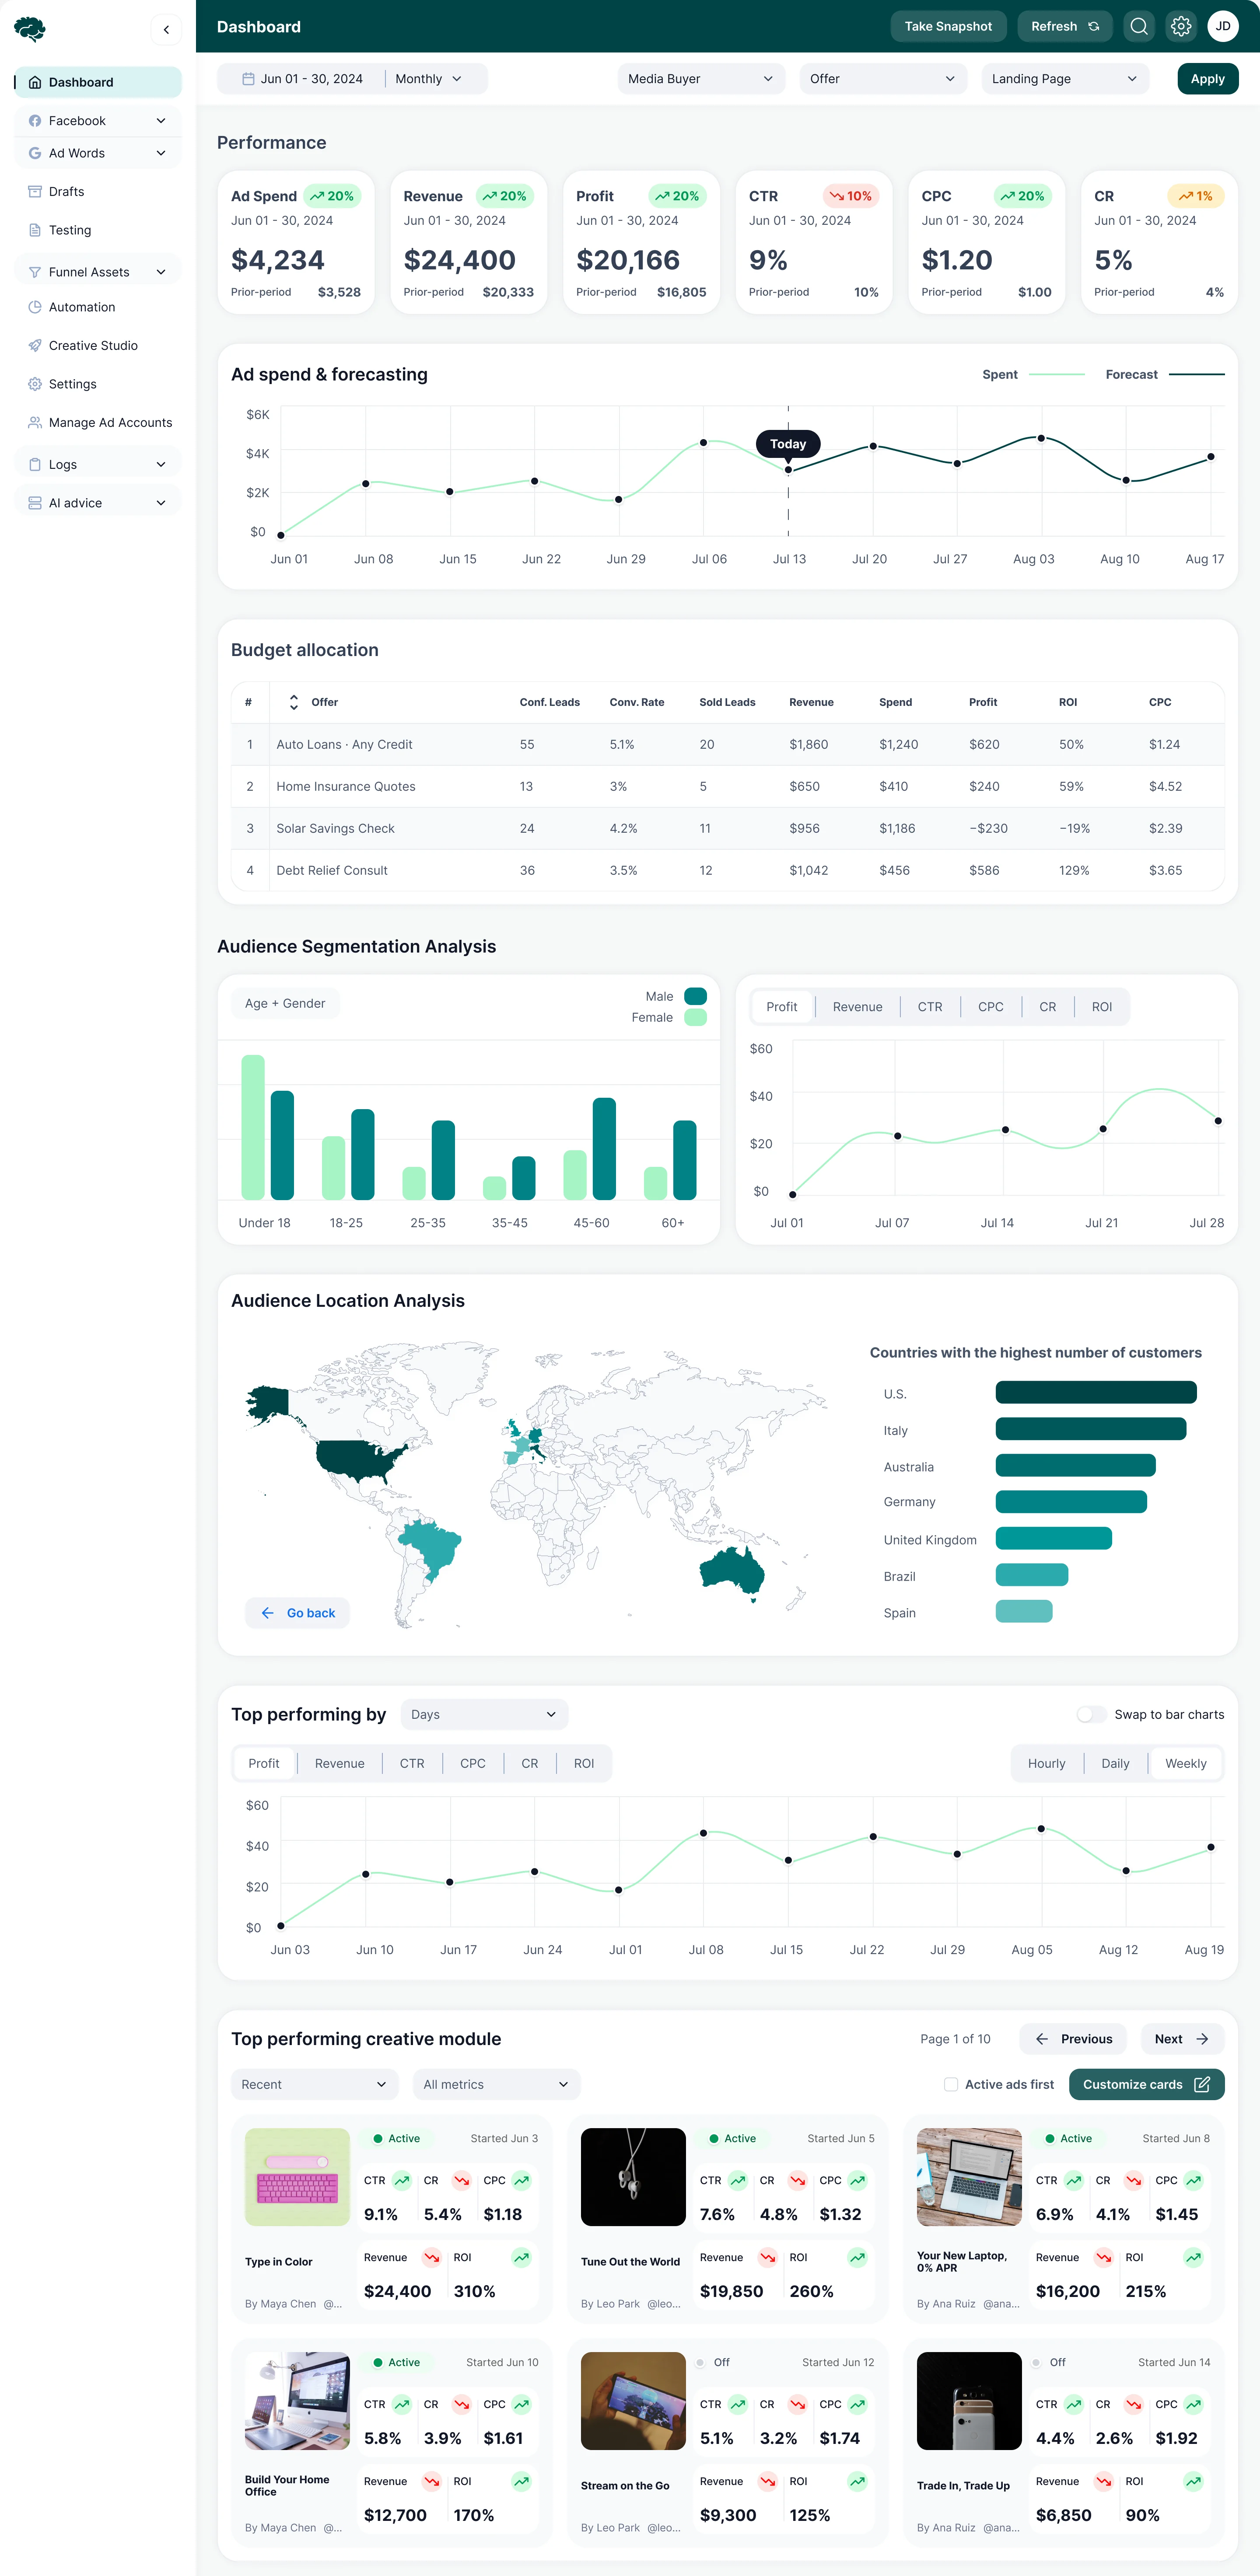
Performance data with a reading order
- Found
- Spend, revenue, profit, CTR, CPC, conversion, budget, audiences and creatives all competed for the first look.
- Decided
- One order down the page: how the money performs, where it is going, who responds, and what works, each block answering the question the one above raises.
- For the user
- A buyer checks the numbers, sees the forecast against the budget, and finds the audience and creative behind the result without leaving the page.
-
How the money performs
Ad spend, revenue, profit, CTR, CPC and conversion, each against the prior period.
-
Where it is going
Spend against its forecast, then the budget by offer with leads, revenue, profit and ROI.
-
Who responds
Audiences by age and gender, then by country, each switchable between metrics.
-
What works
The best days and hours, then the creatives that earn the most, with their numbers on the card.
How the work progressed
Four phases, each closing a question before the next one opened.
-
Discovery
5 hrs
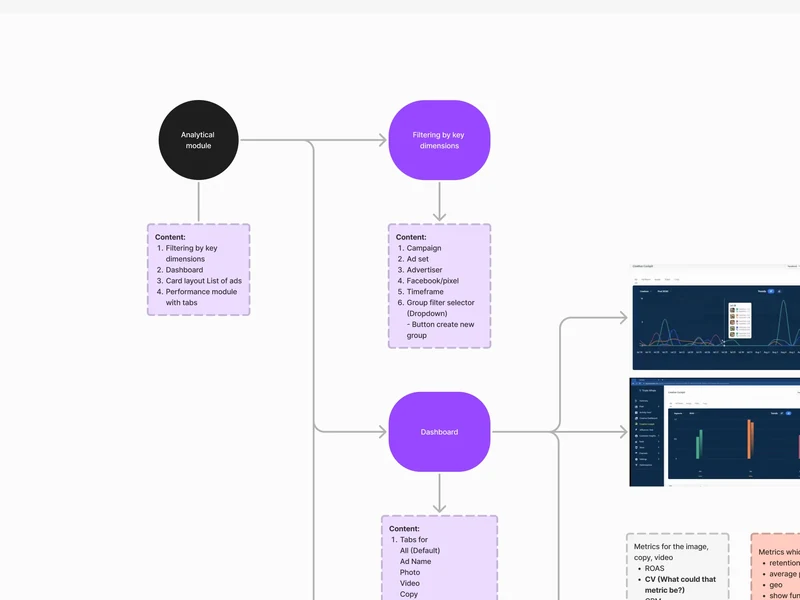
What the analytics had to answer, and what media buyers were still working out by hand
Artifact A structure board for the analytics module: filters, metrics and open questions
-
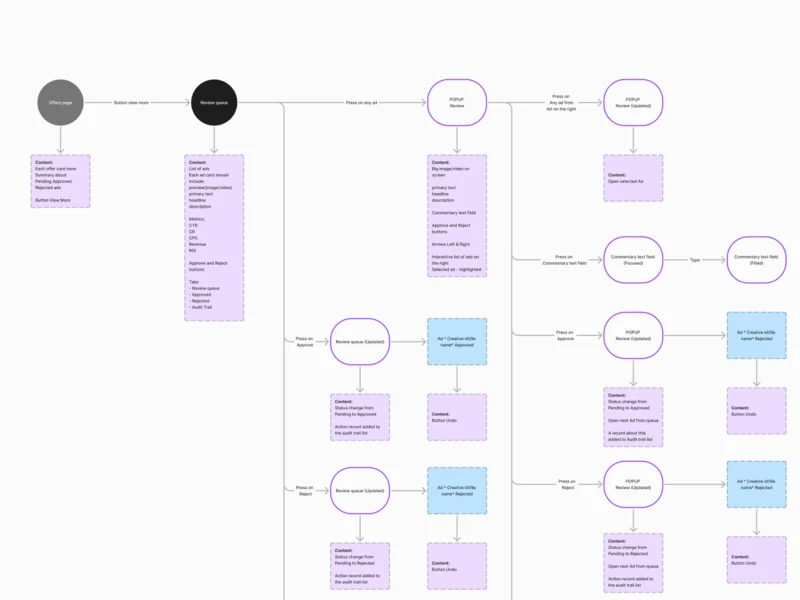
User Flow
100 hrs
How each module starts, branches and ends, including the states a demo never shows
Artifact End-to-end flows for every module, with each screen’s content beside its node
-
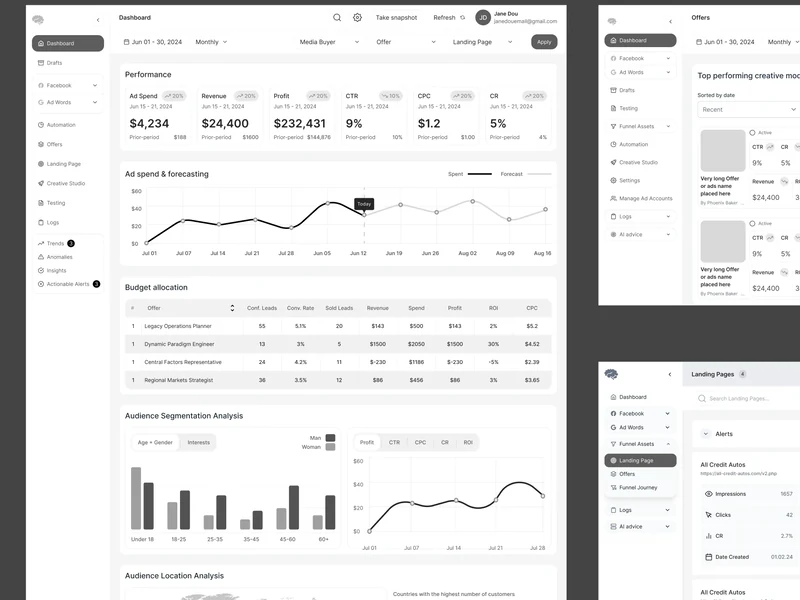
Wireframes
200 hrs
Where each chart, table and filter sits, before colour could hide a problem
Artifact Grey wireframes for dashboards, rules, landing pages and notifications
-
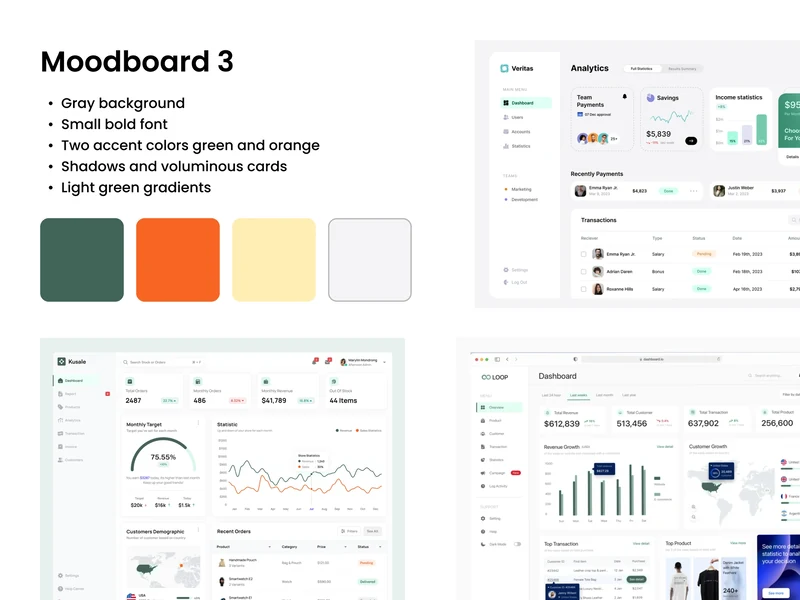
UI & Design System
245 hrs
One visual system for the whole product, chosen from four directions
Artifact The final UI and a component library with its states
From modules to one operating model
- Found
- Each module had grown on its own: its own filters, its own idea of a period, its own way to reach the next step.
- Decided
- Every flow was drawn end to end first, so modules share filters, time ranges and entry points, and hand work to each other.
-
Dashboard
The page follows the order a buyer decides in: performance, forecast, budget, audiences, then the AI feed and top creatives.
Open the full map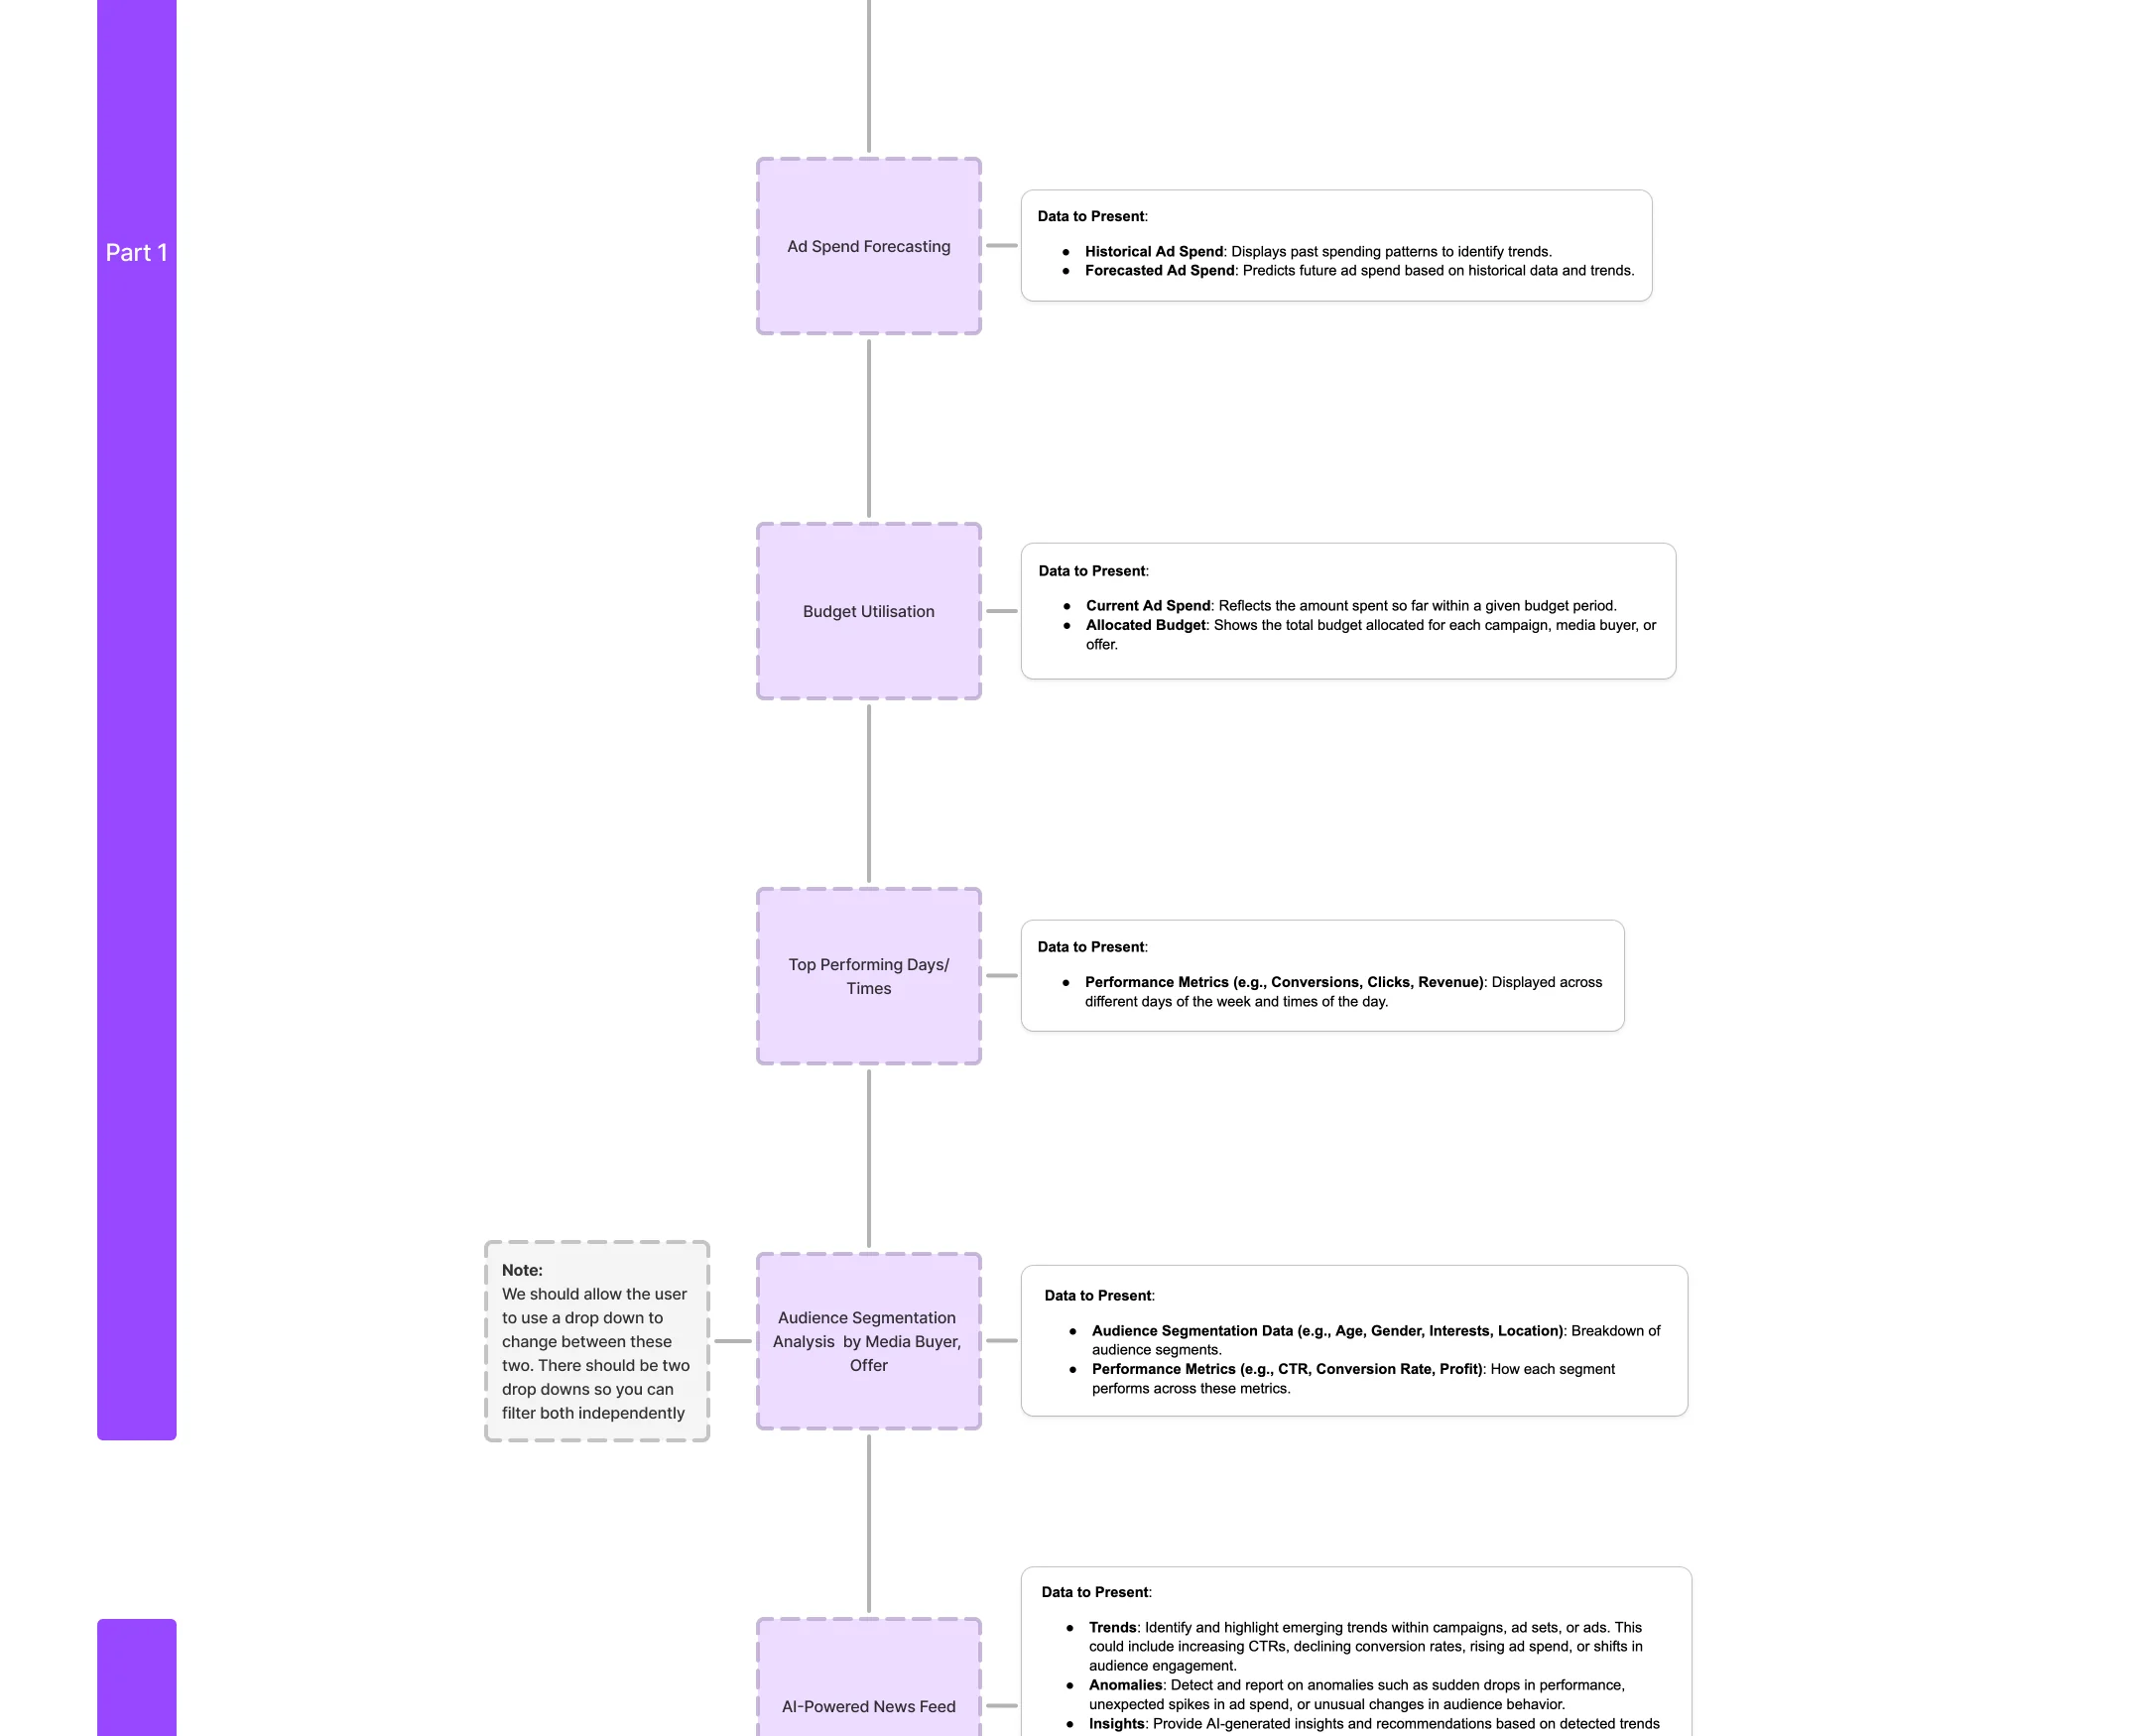
-
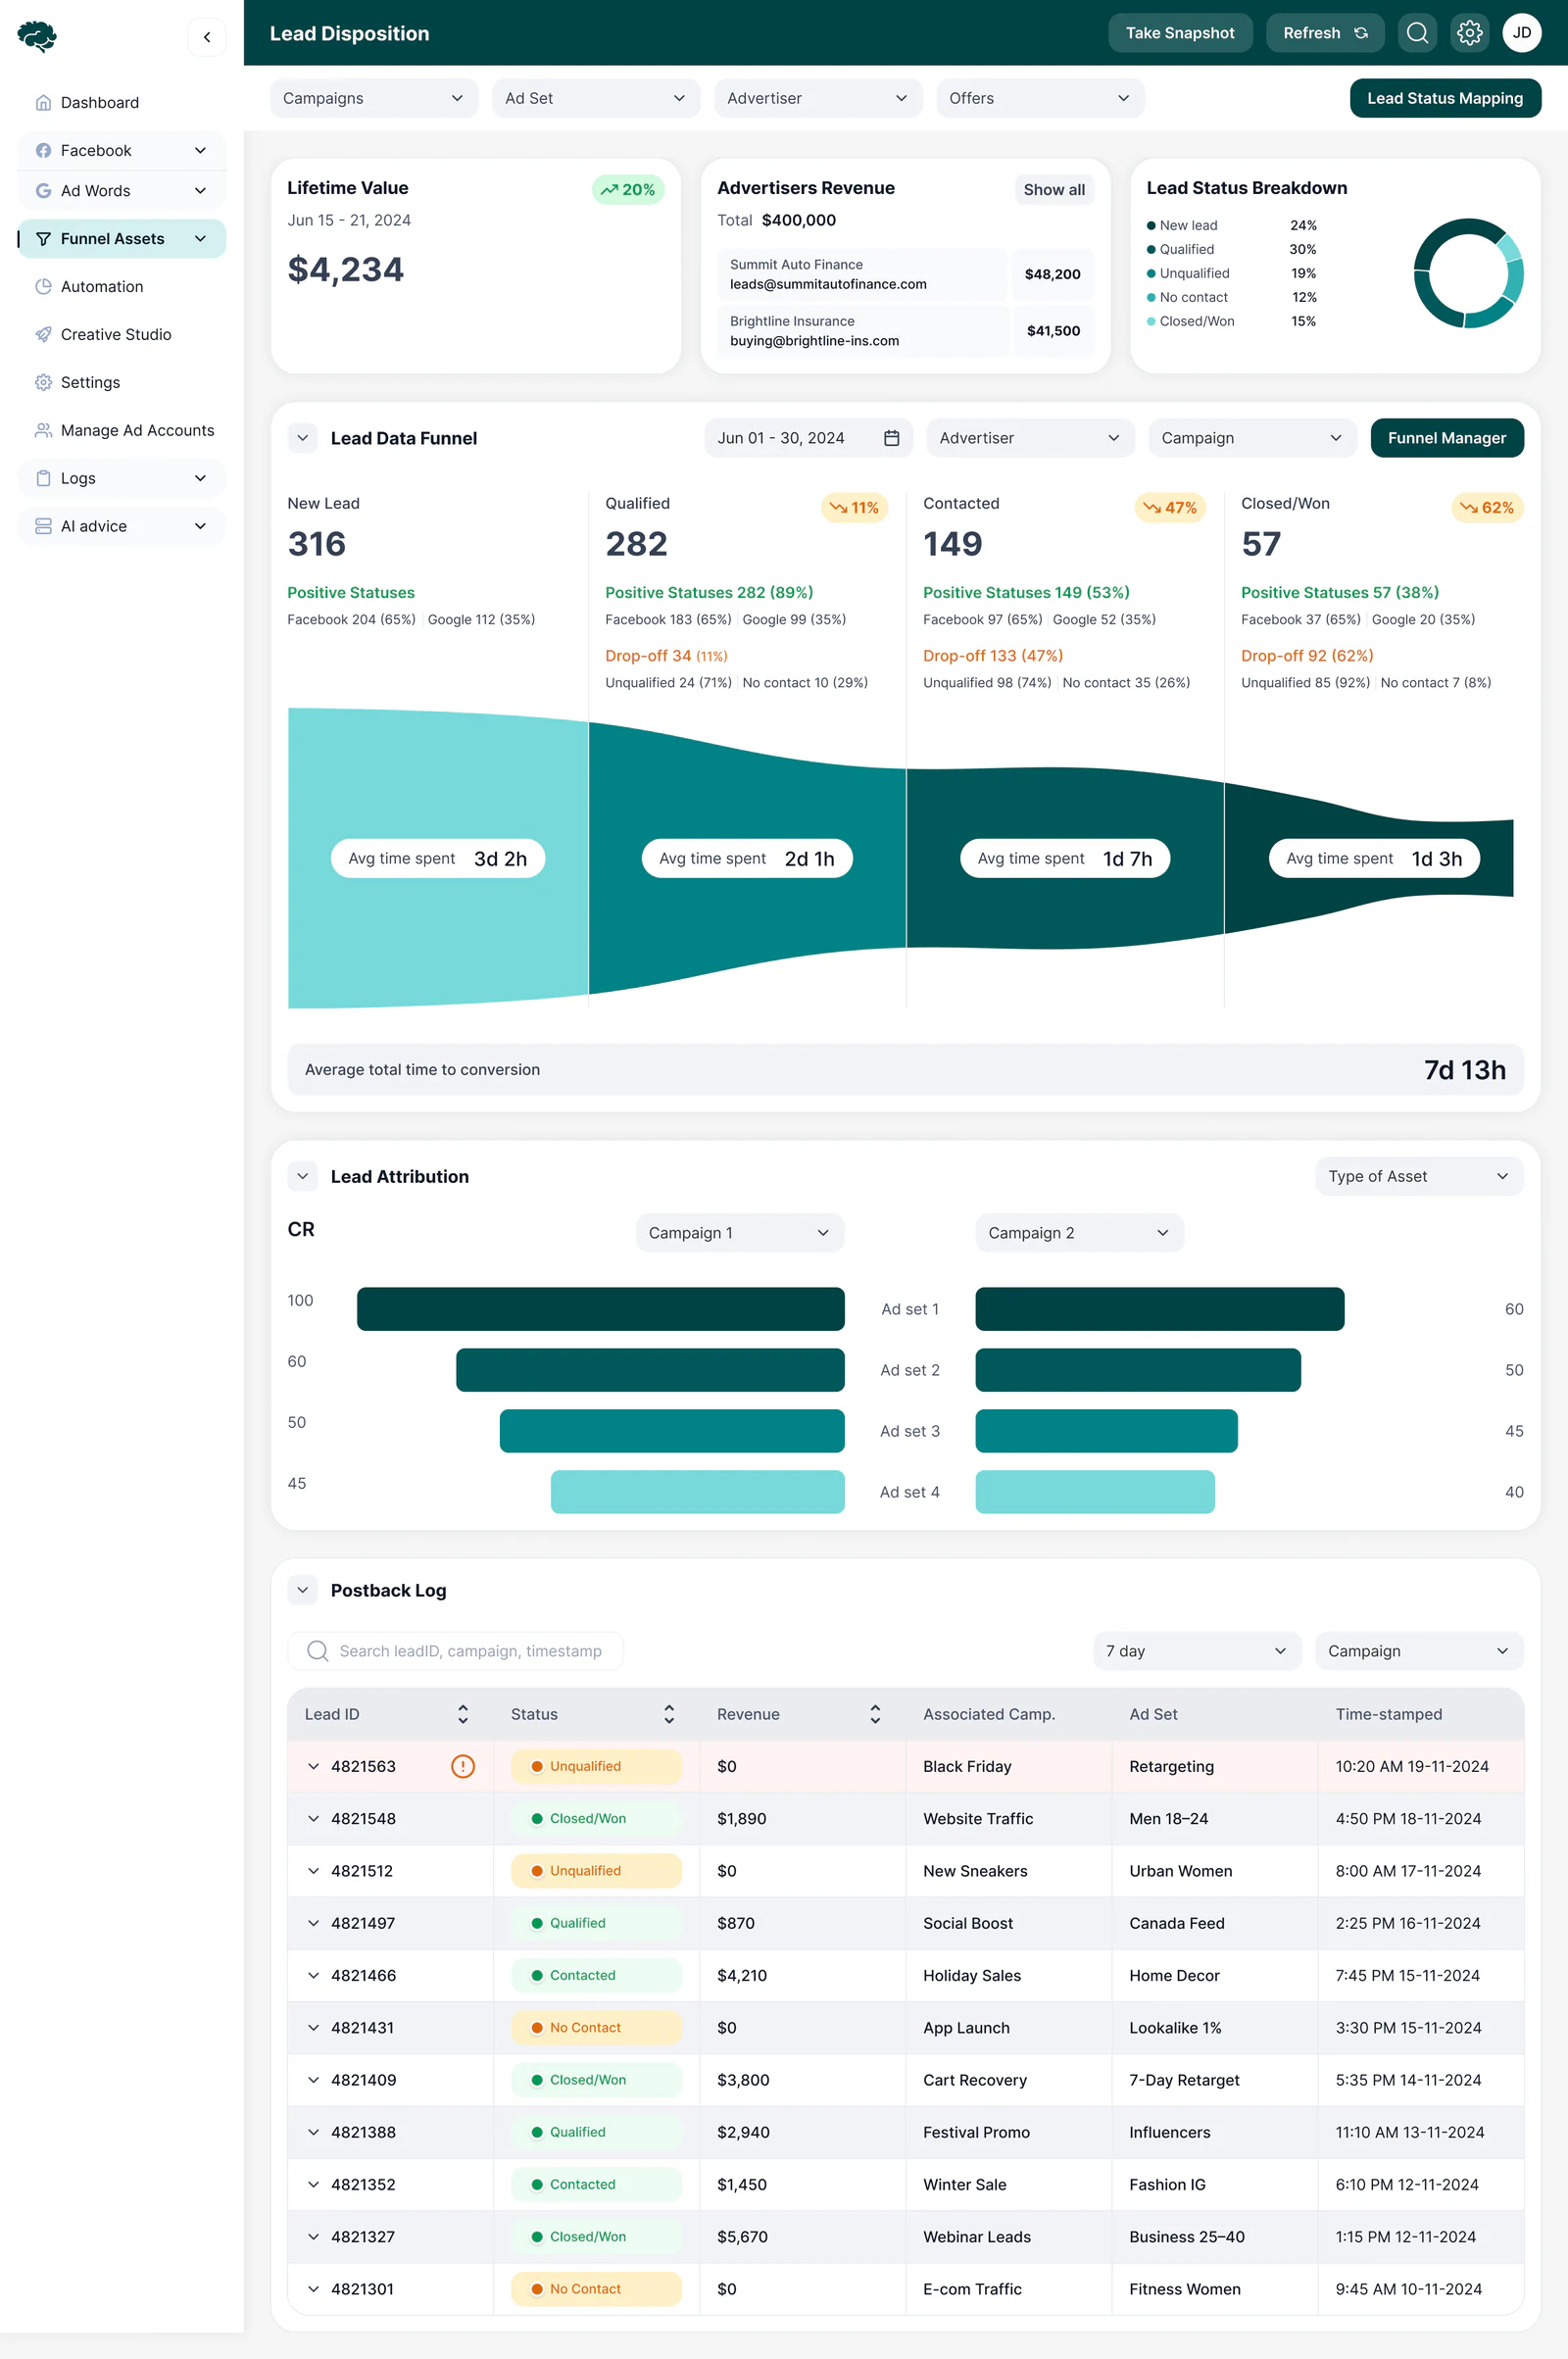
Lead disposition
From the funnel to one lead: filter by campaign or ad set, open a stage, and fix a lead’s data where the error is.
Open the full map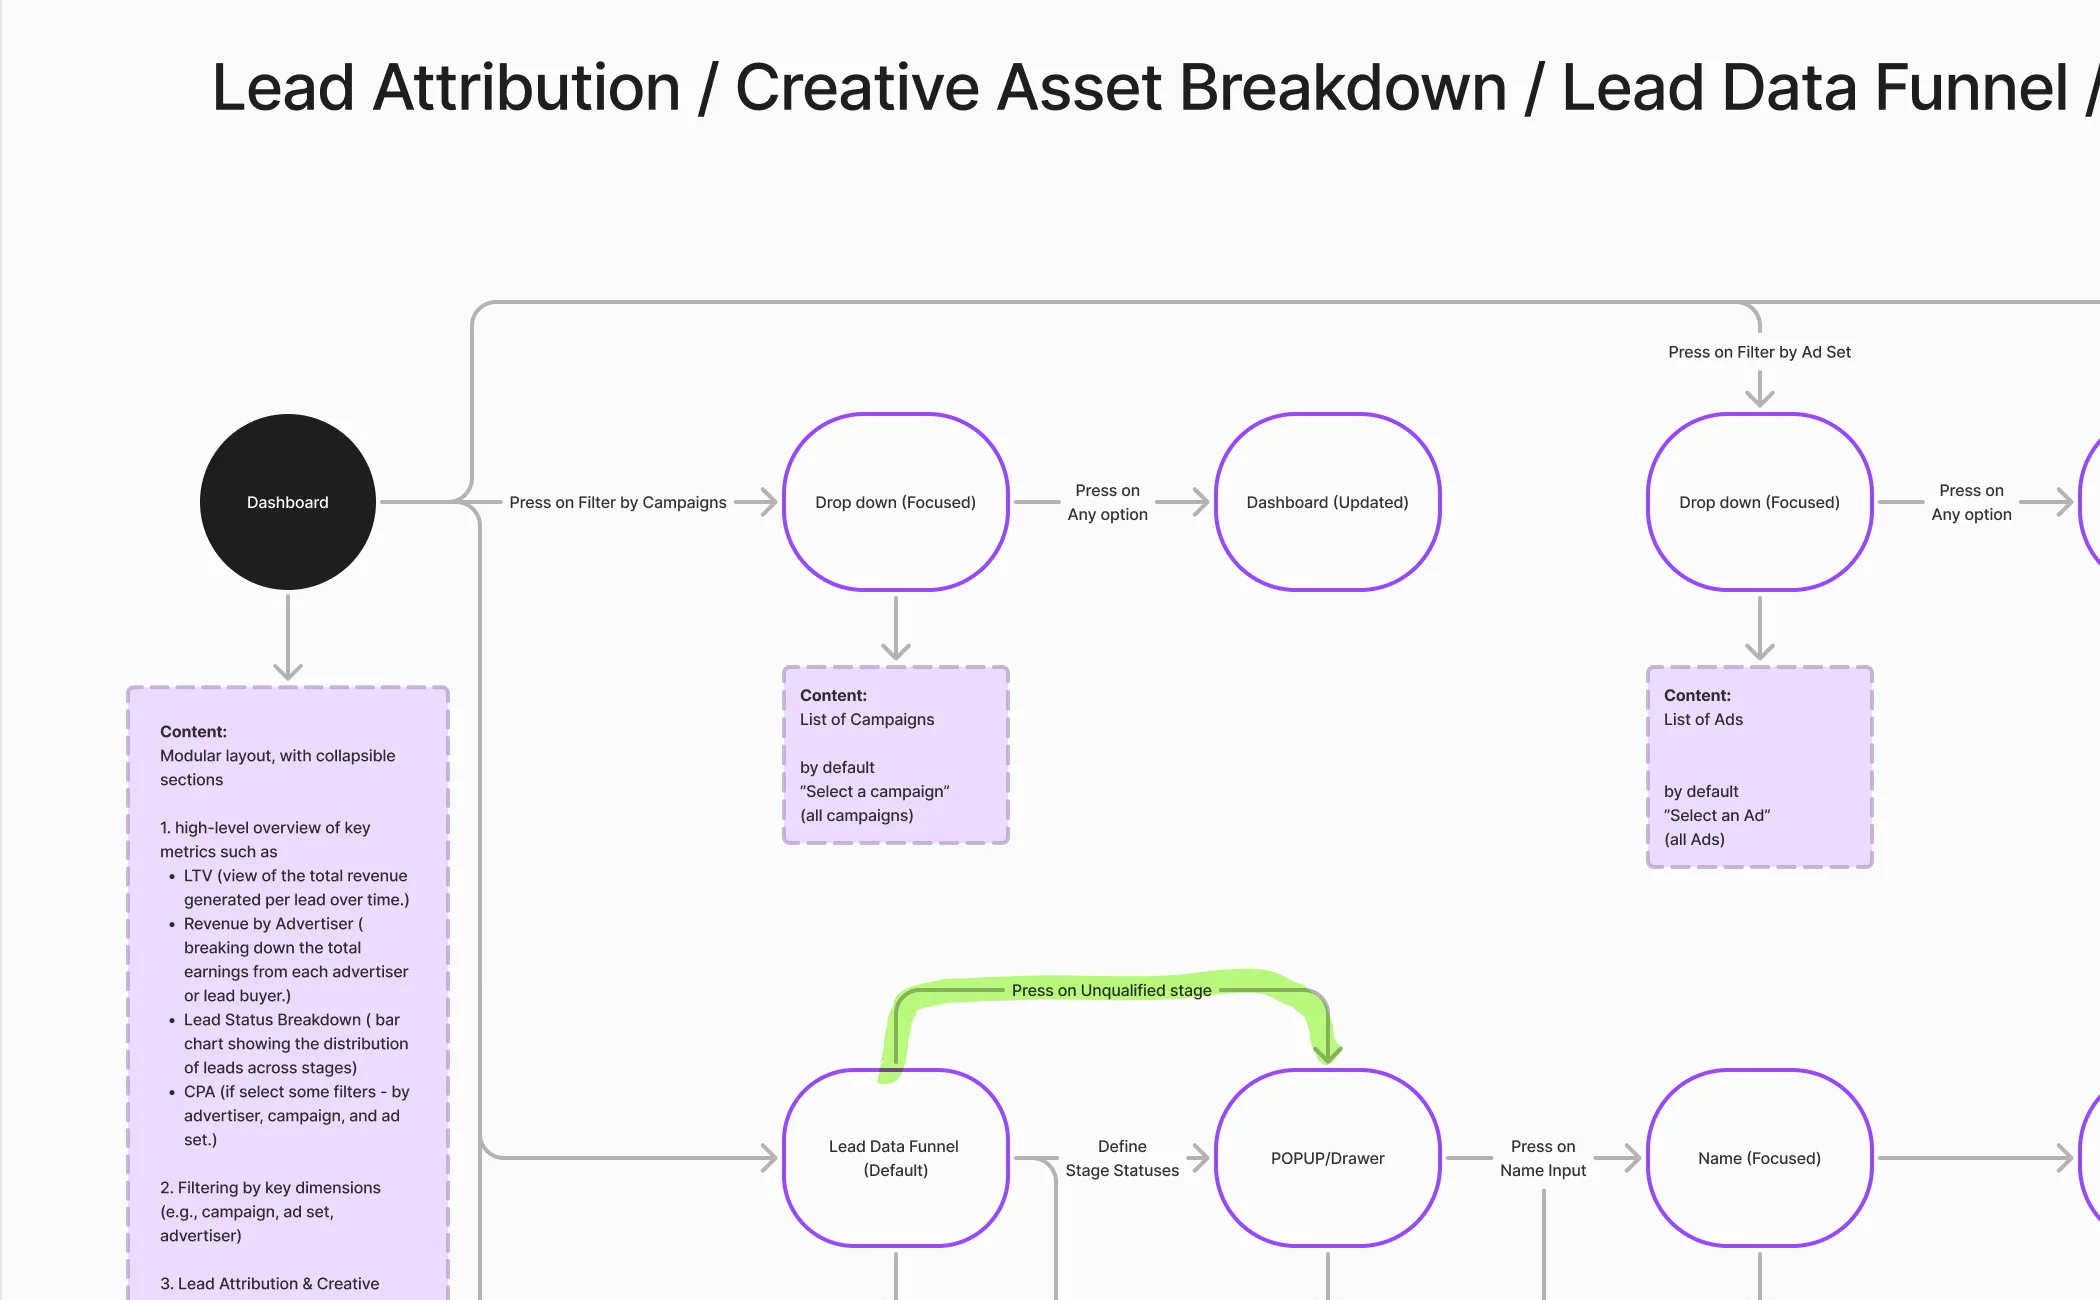
-
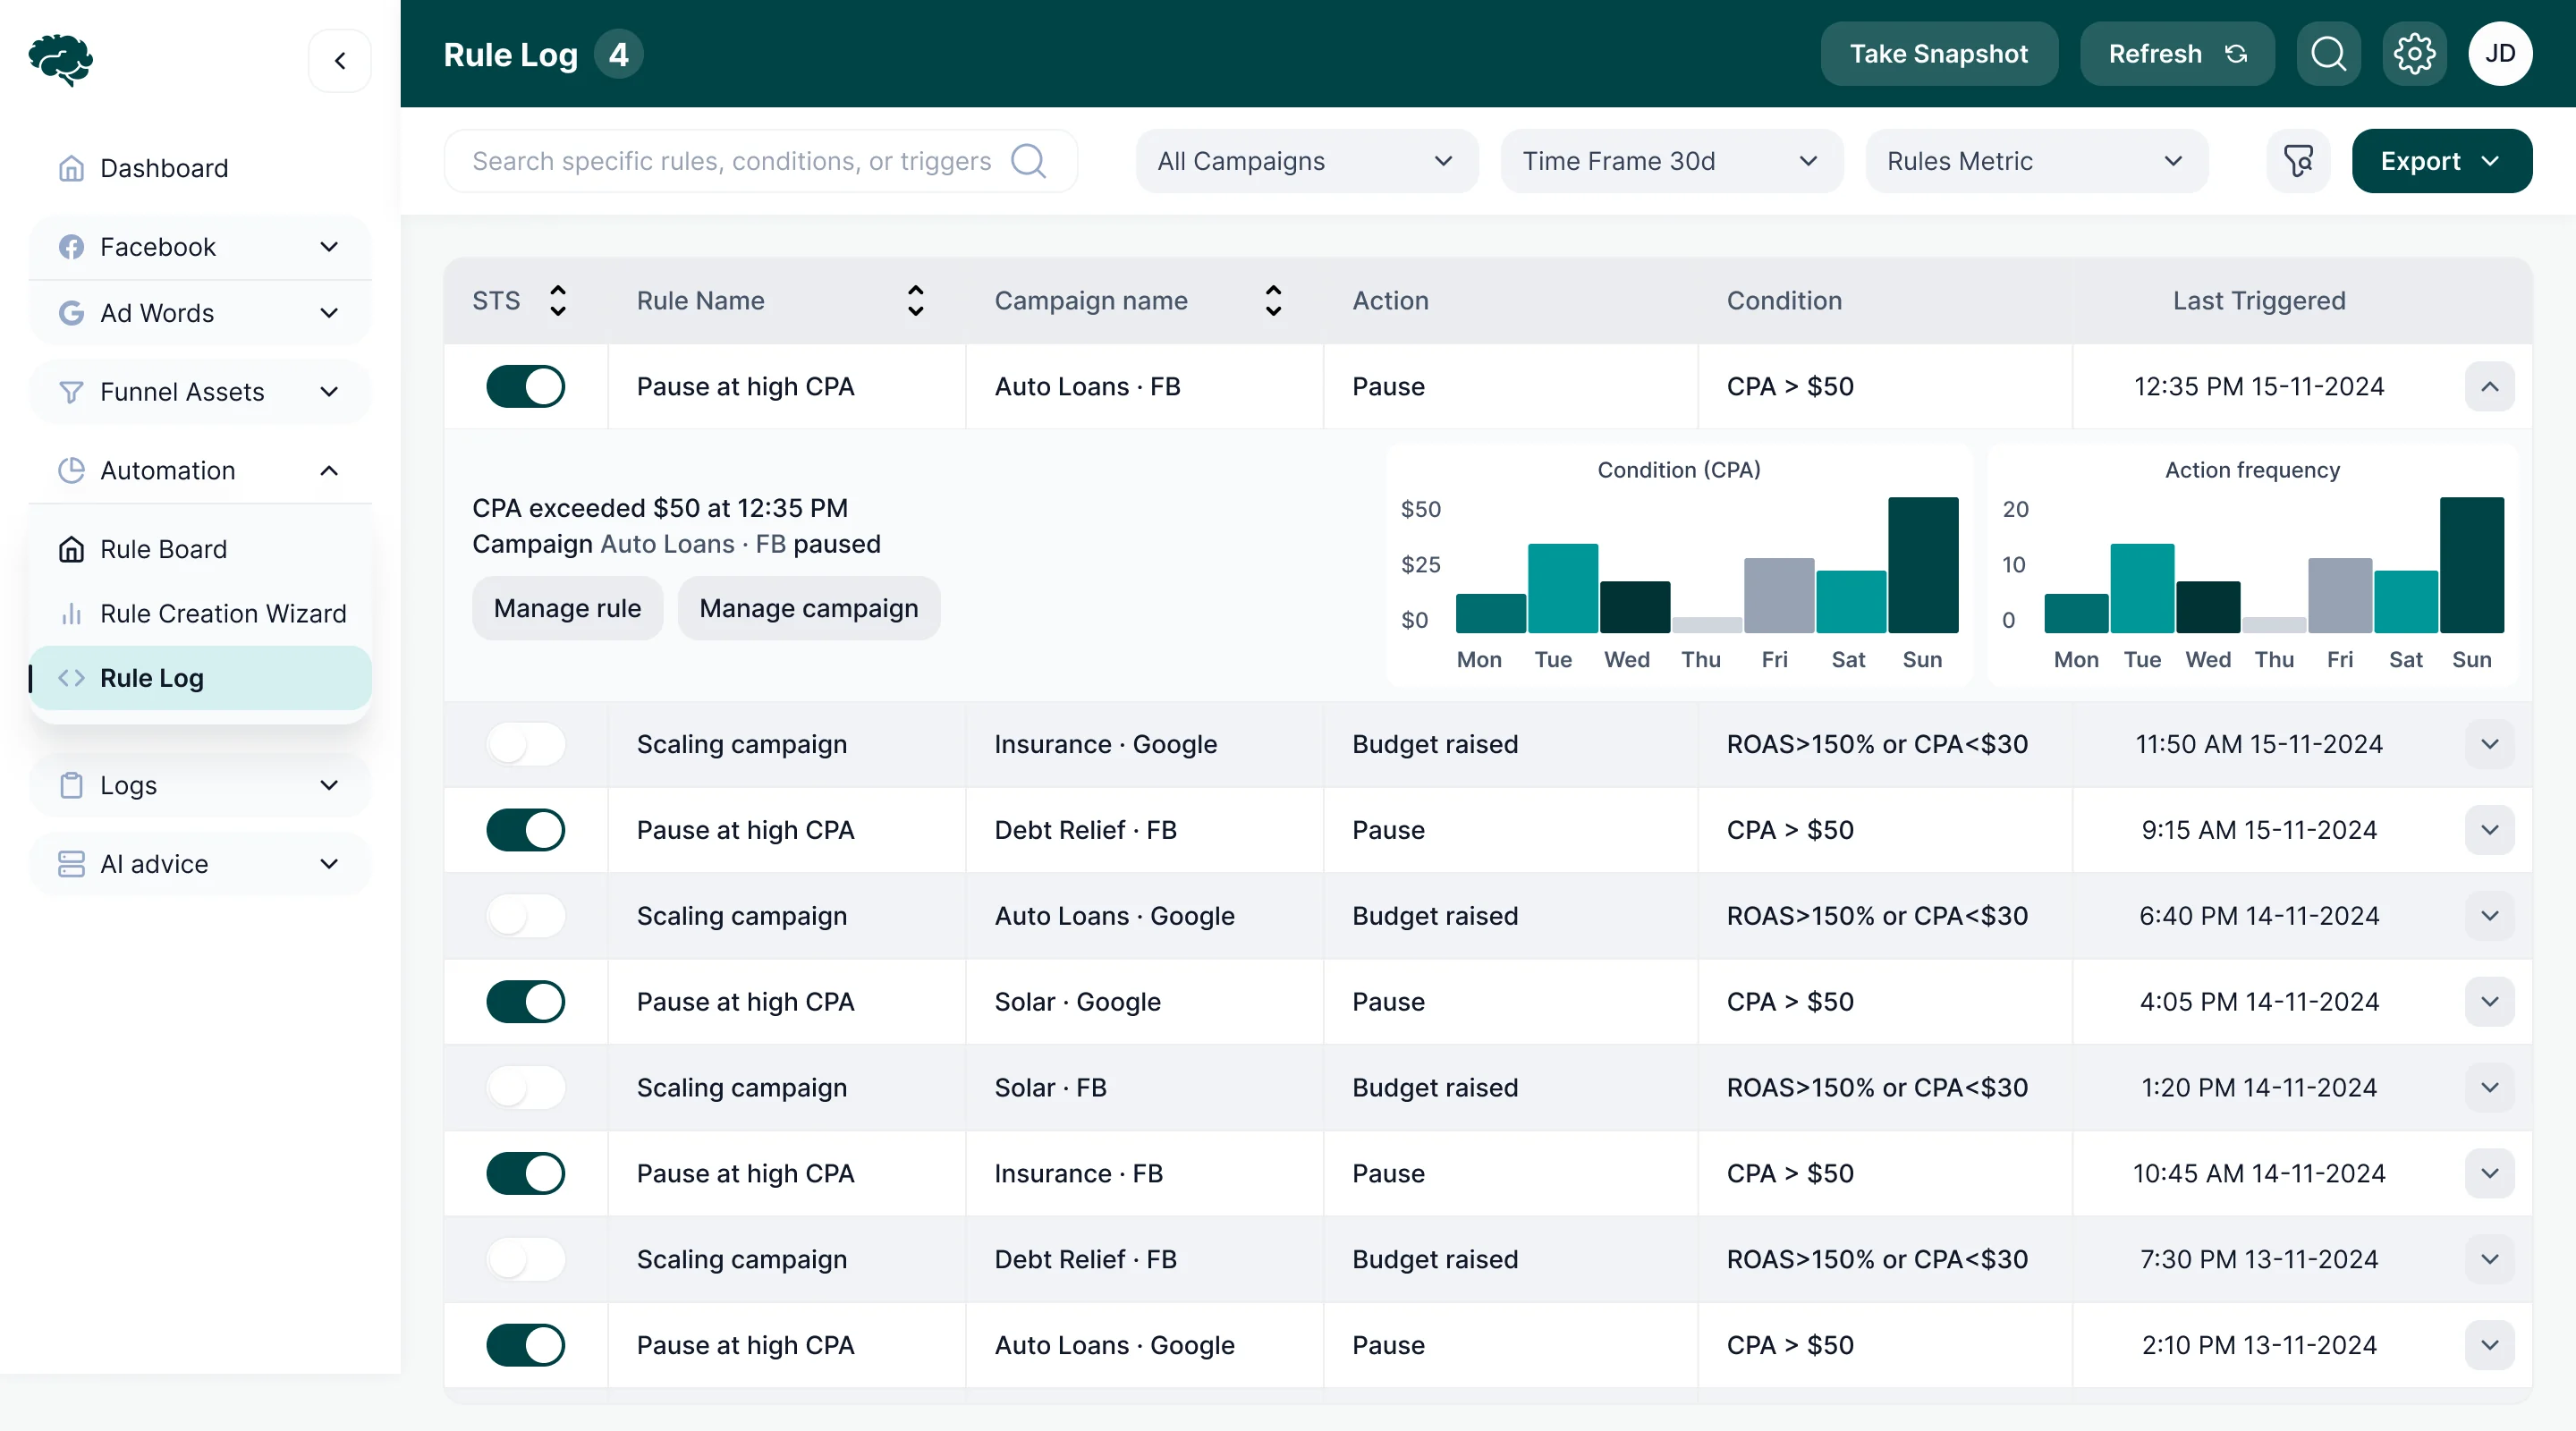
Rules and automation
An empty board says what to do first; every rule card opens its own log of what the rule did.
Open the full map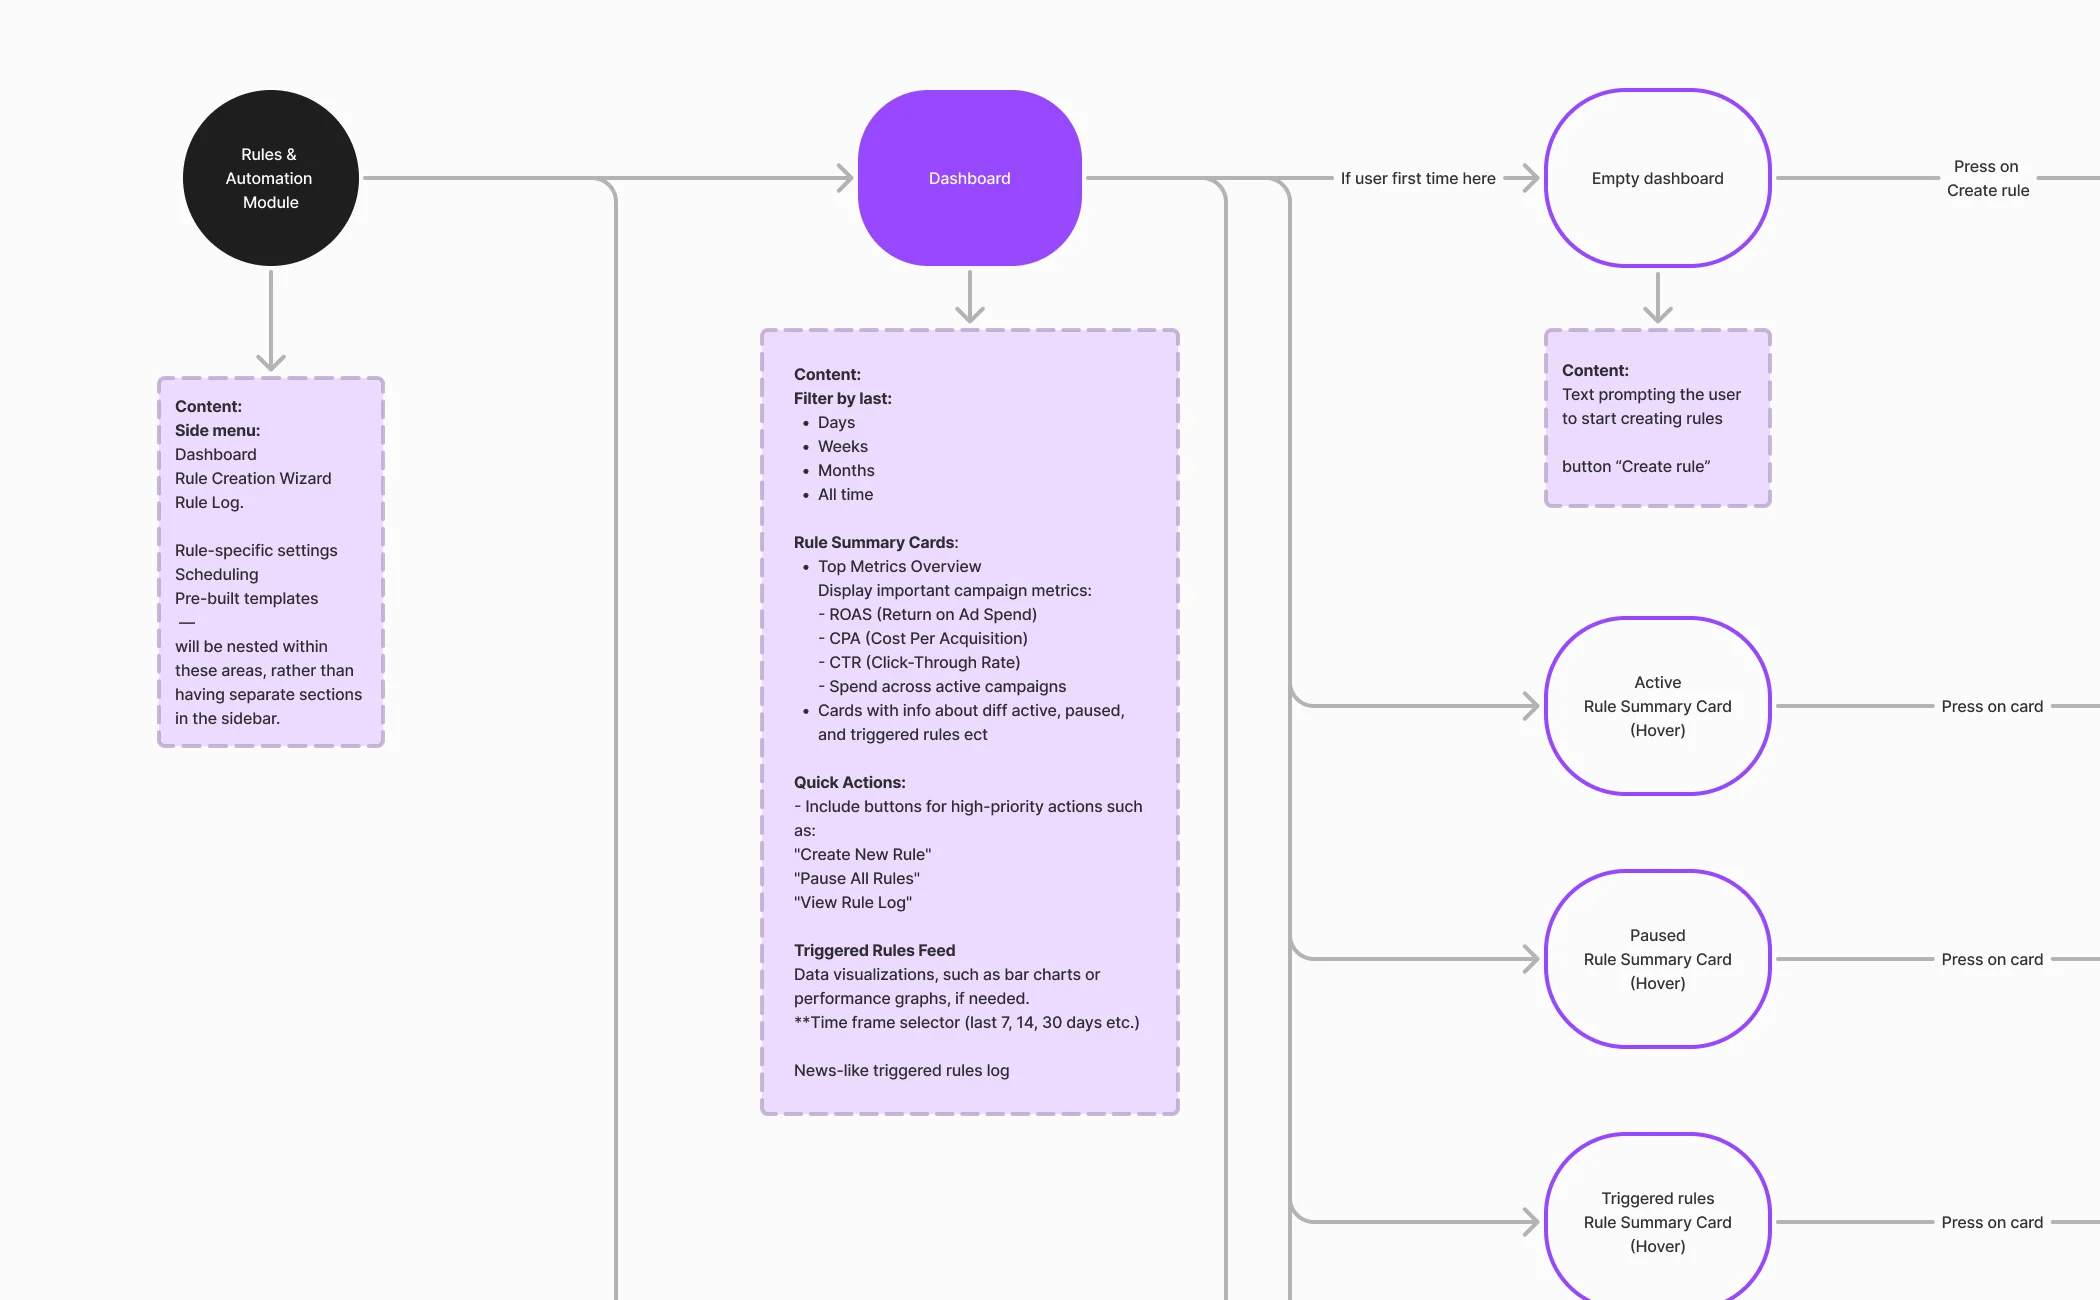
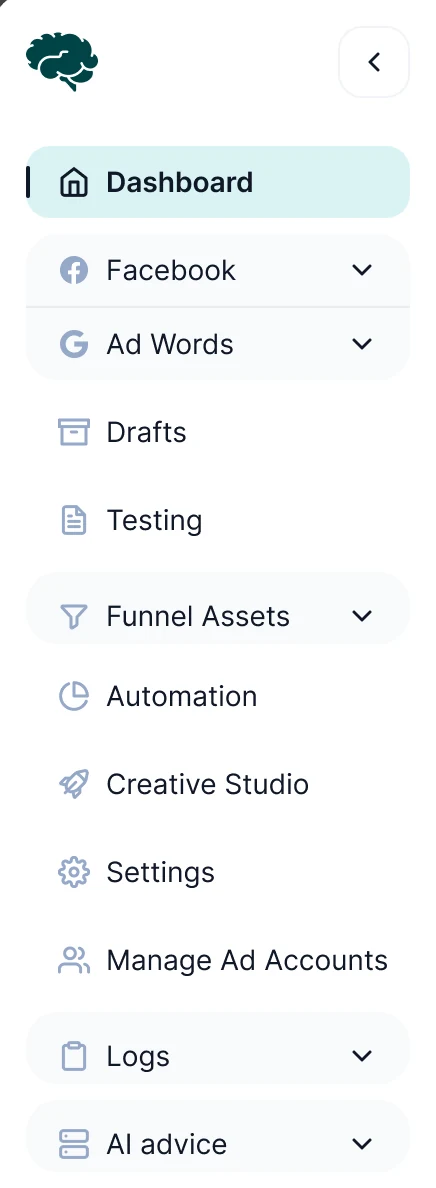
Four jobs the product does for a media buyer
From the funnel to the rules that act on it, then the creatives and campaigns, and the AI signals across them.
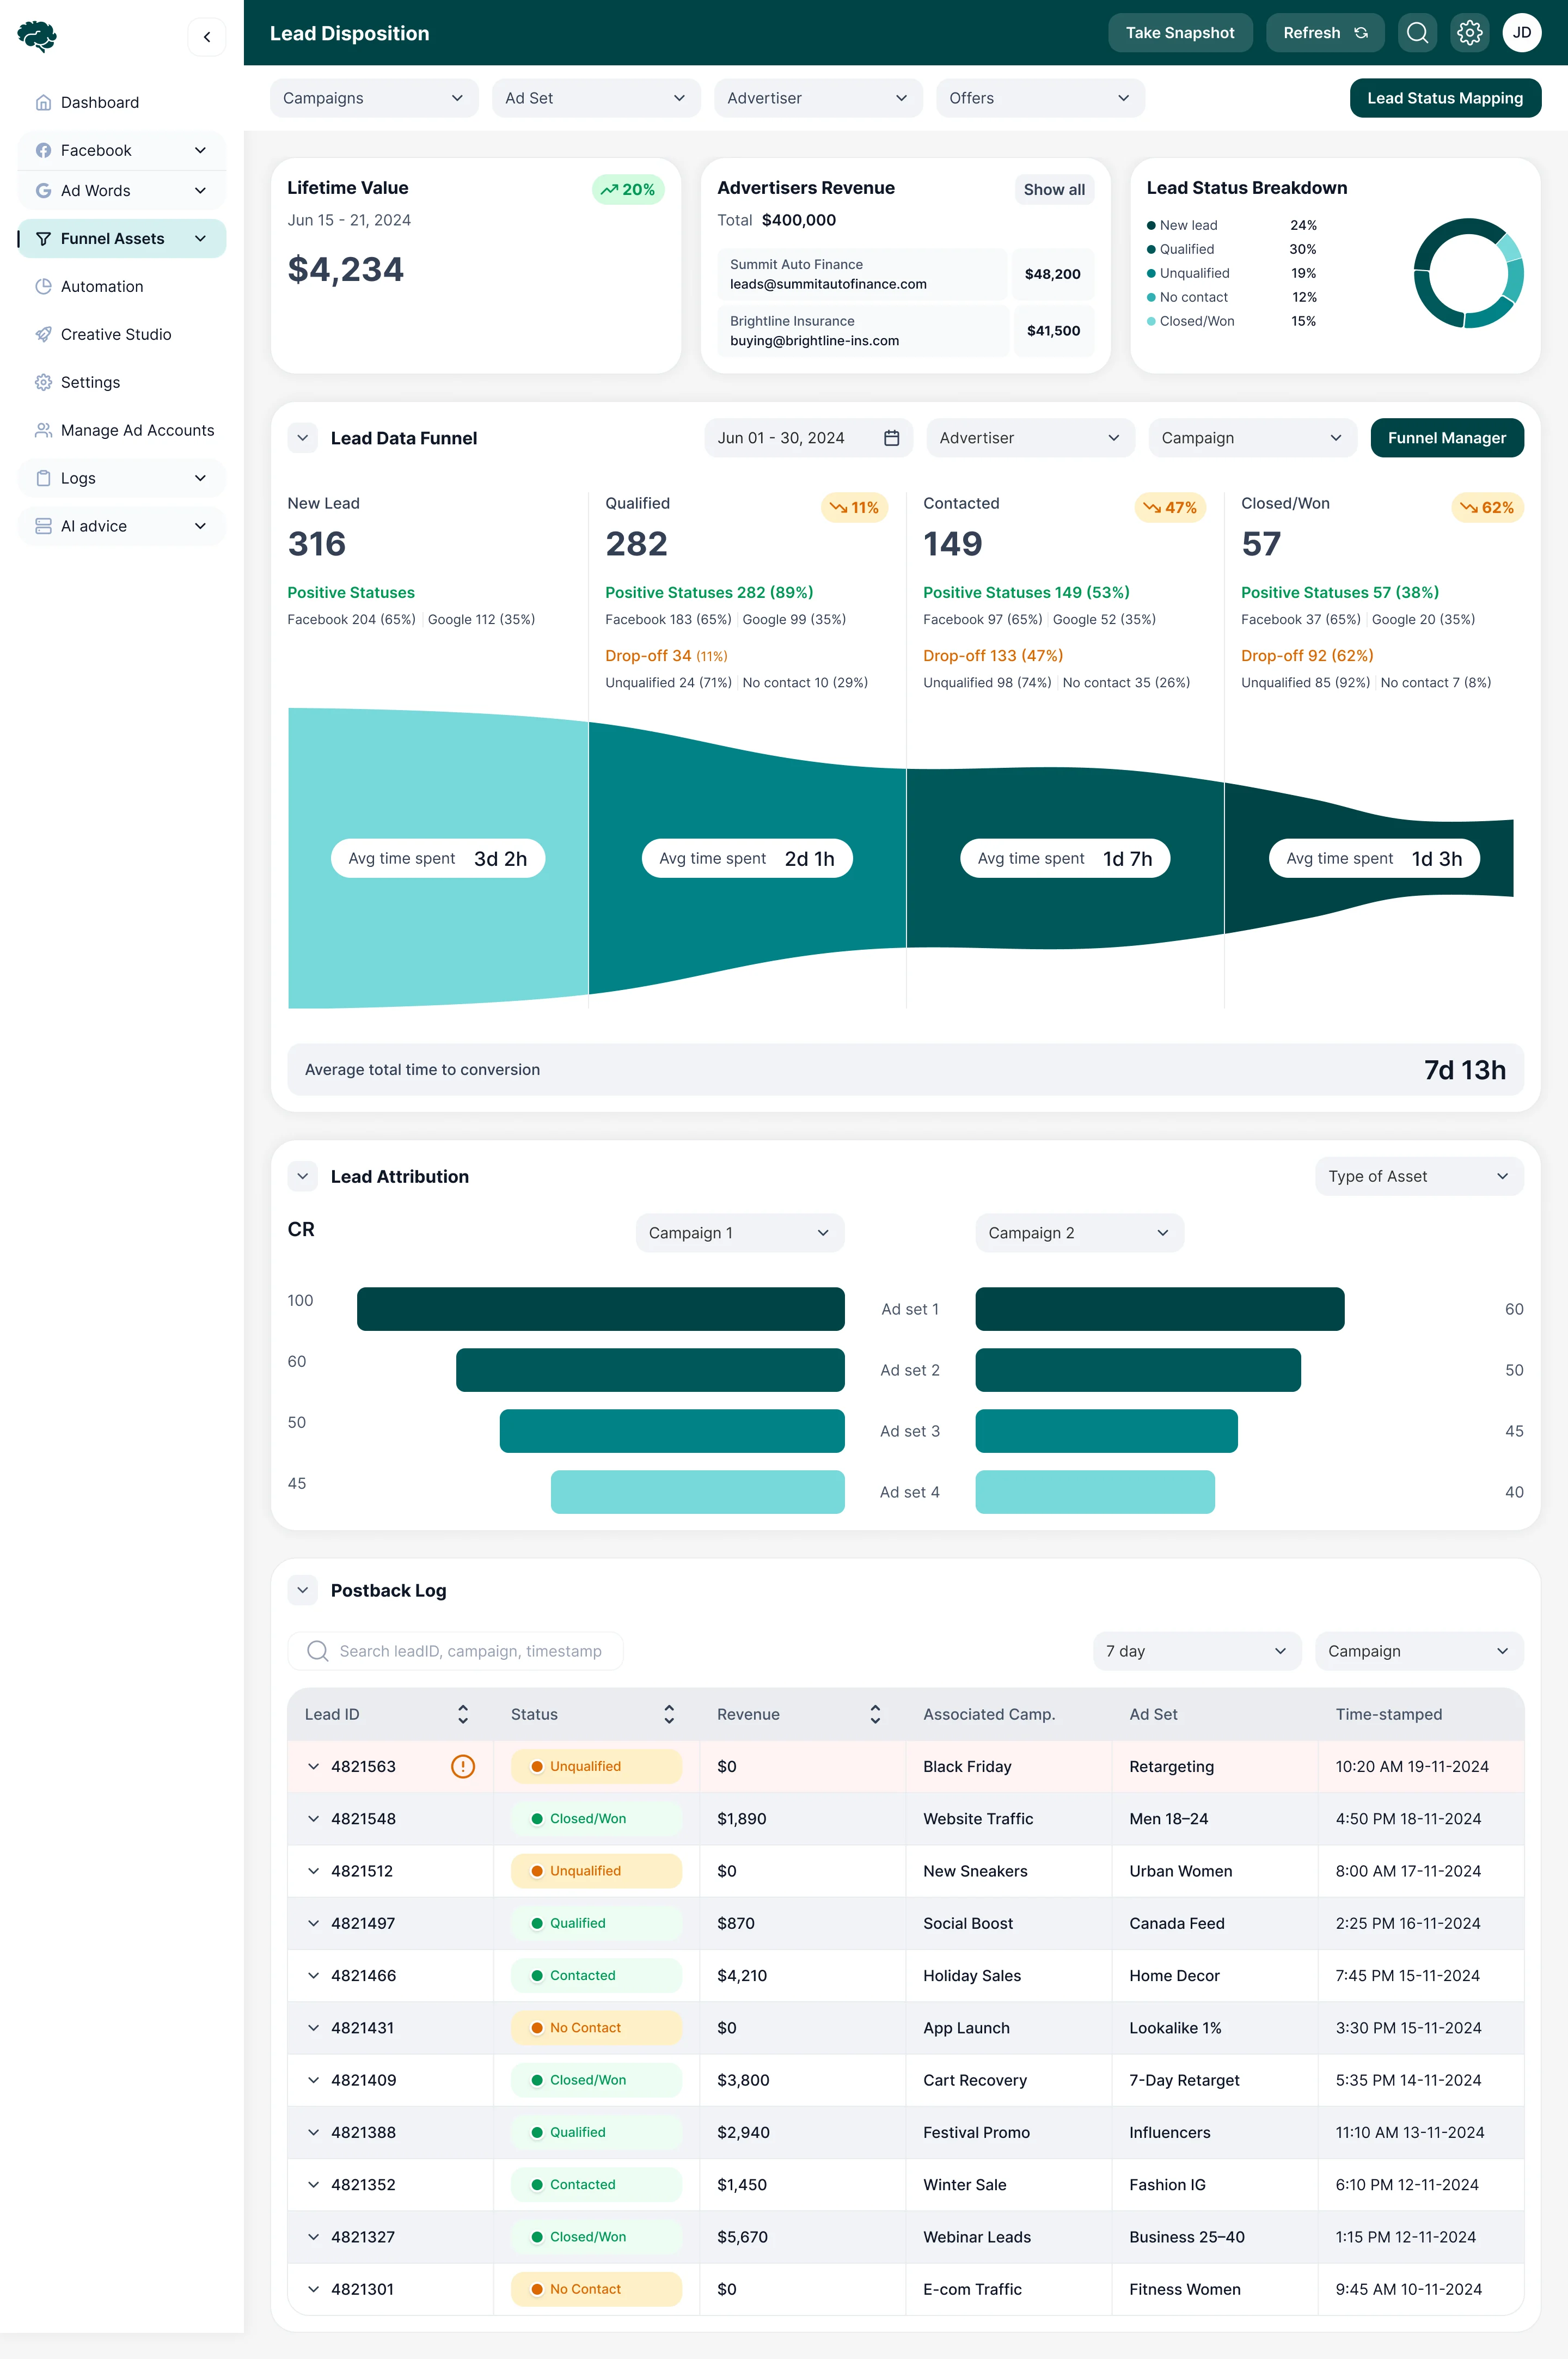
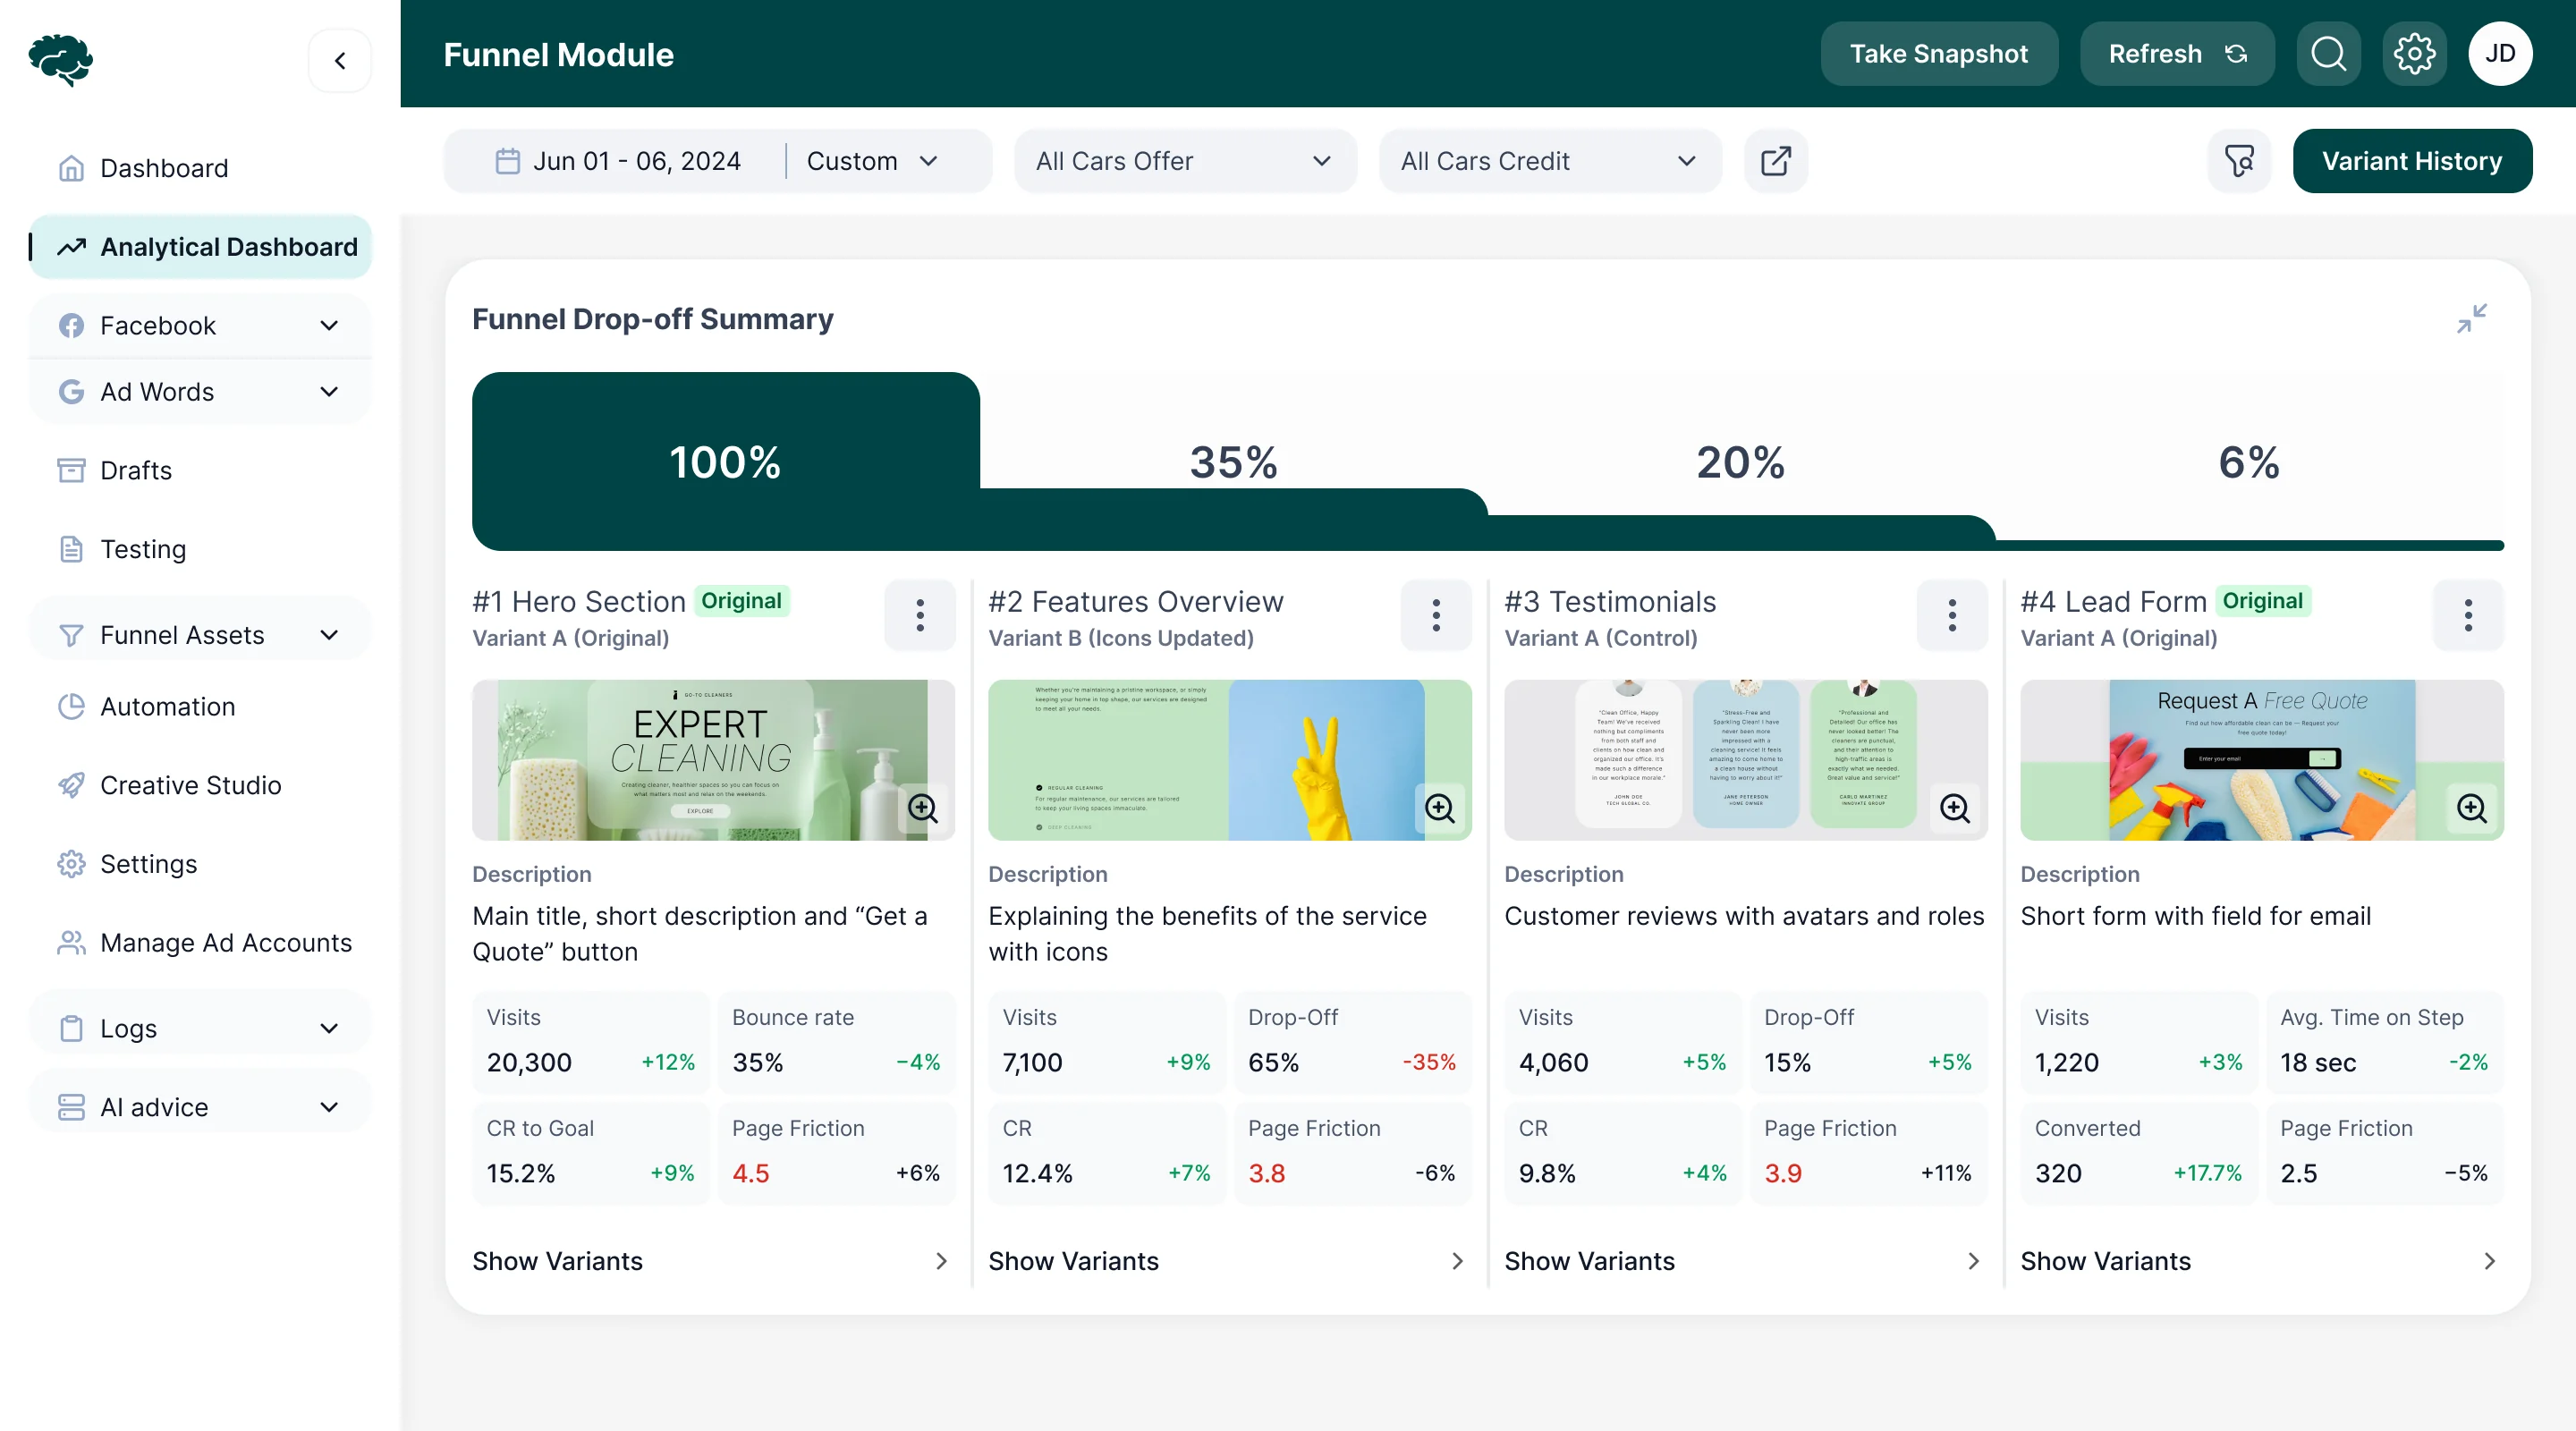
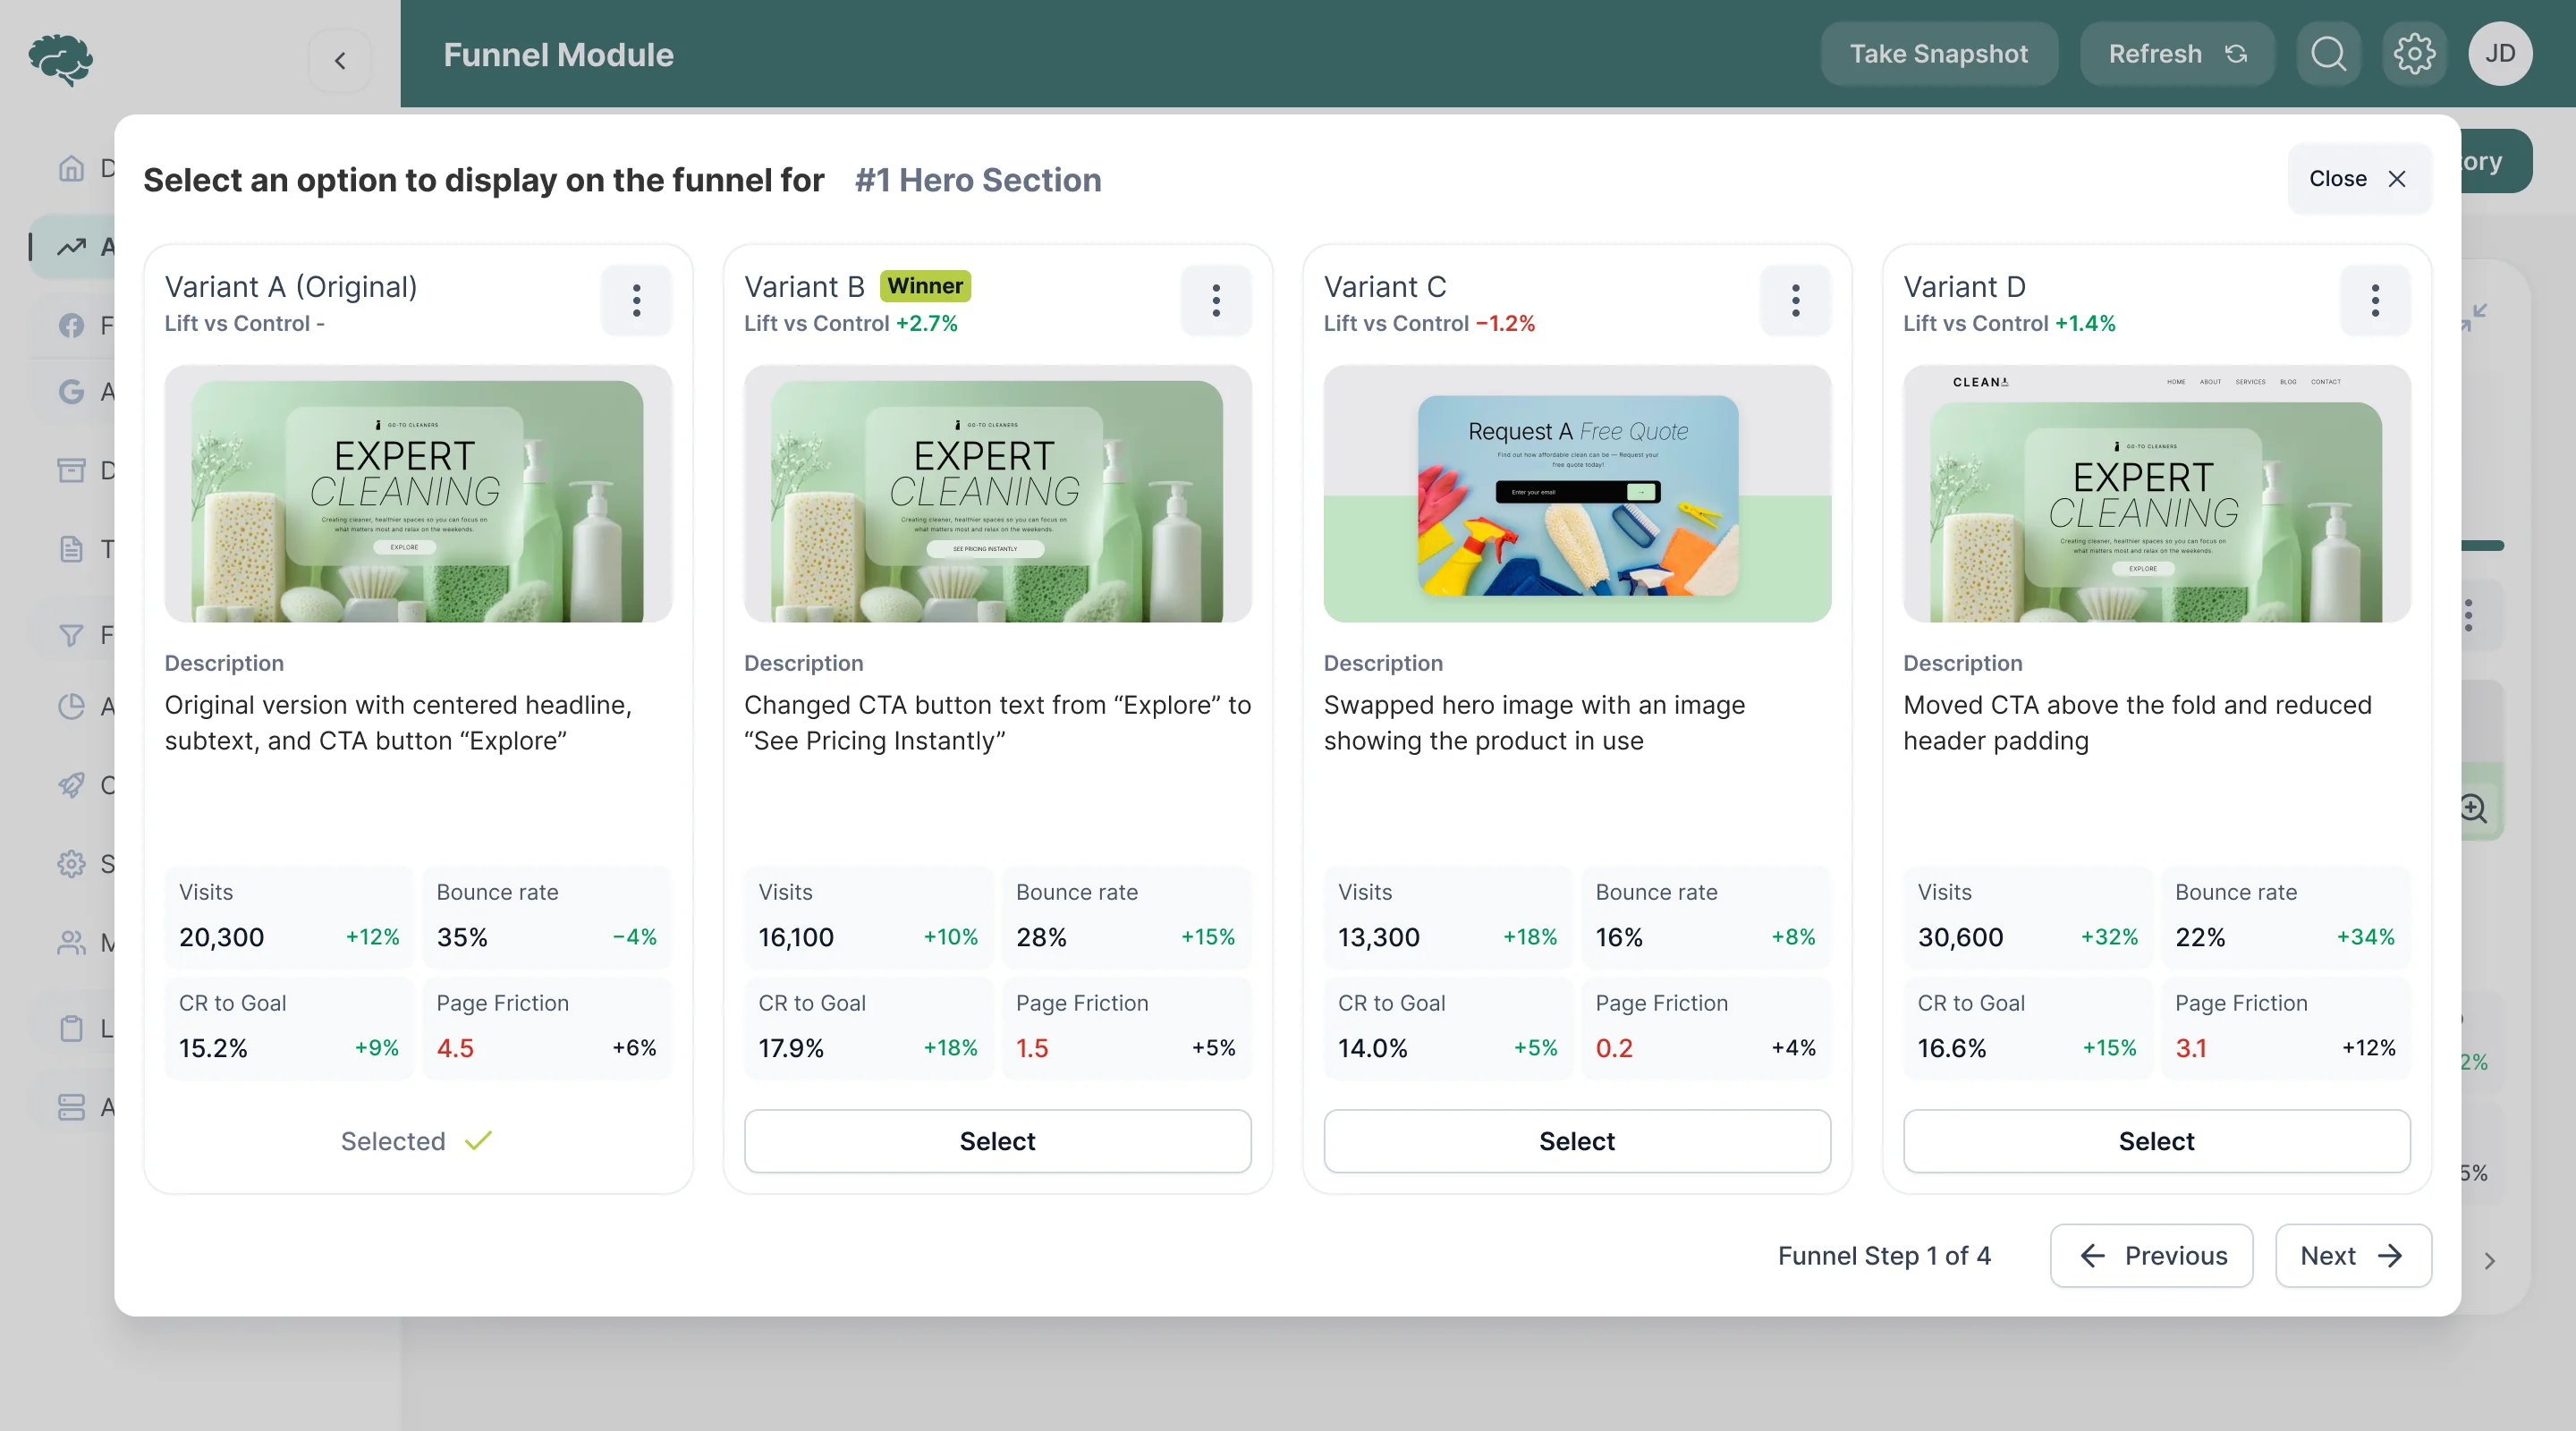
Following leads through the funnel
- Found
- Revenue arrived as one number; where leads stalled, which ad set brought them and which postback failed stayed out of view.
- Decided
- A lead dashboard with the funnel by stage, the time between stages and the drop-off at each; attribution compared across two campaigns; a postback log that flags the lead with a problem in its own row.
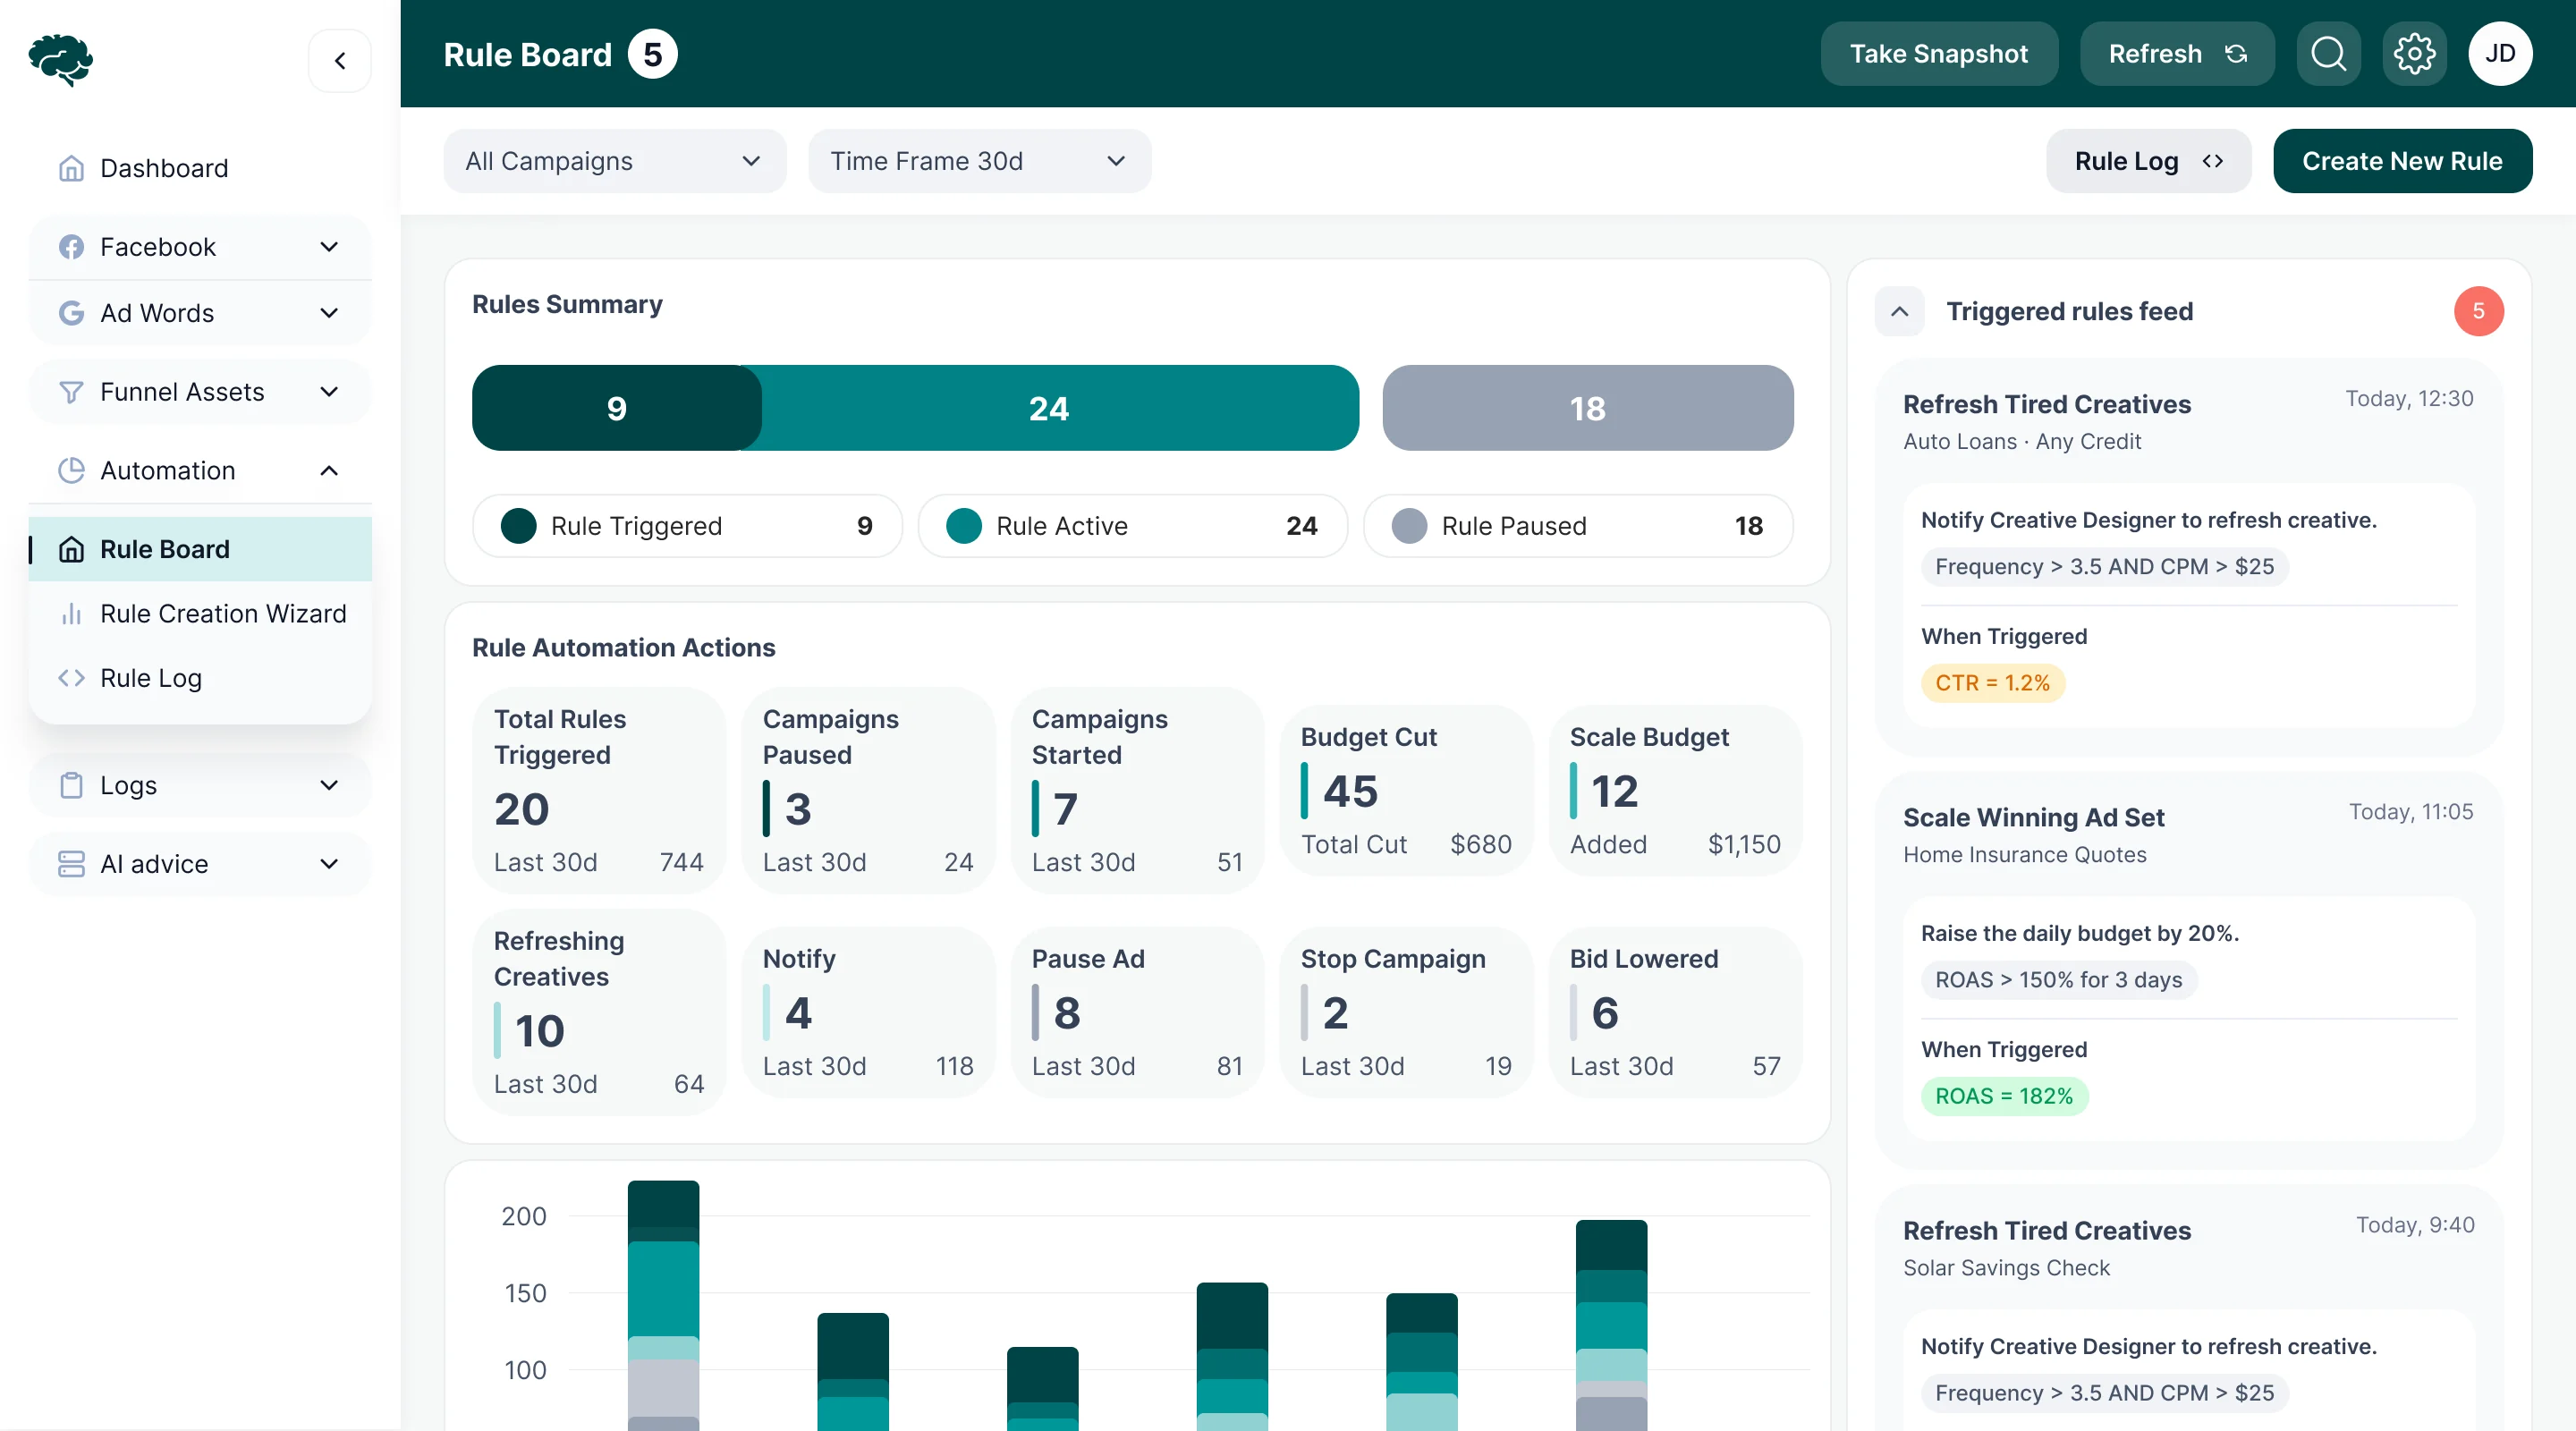
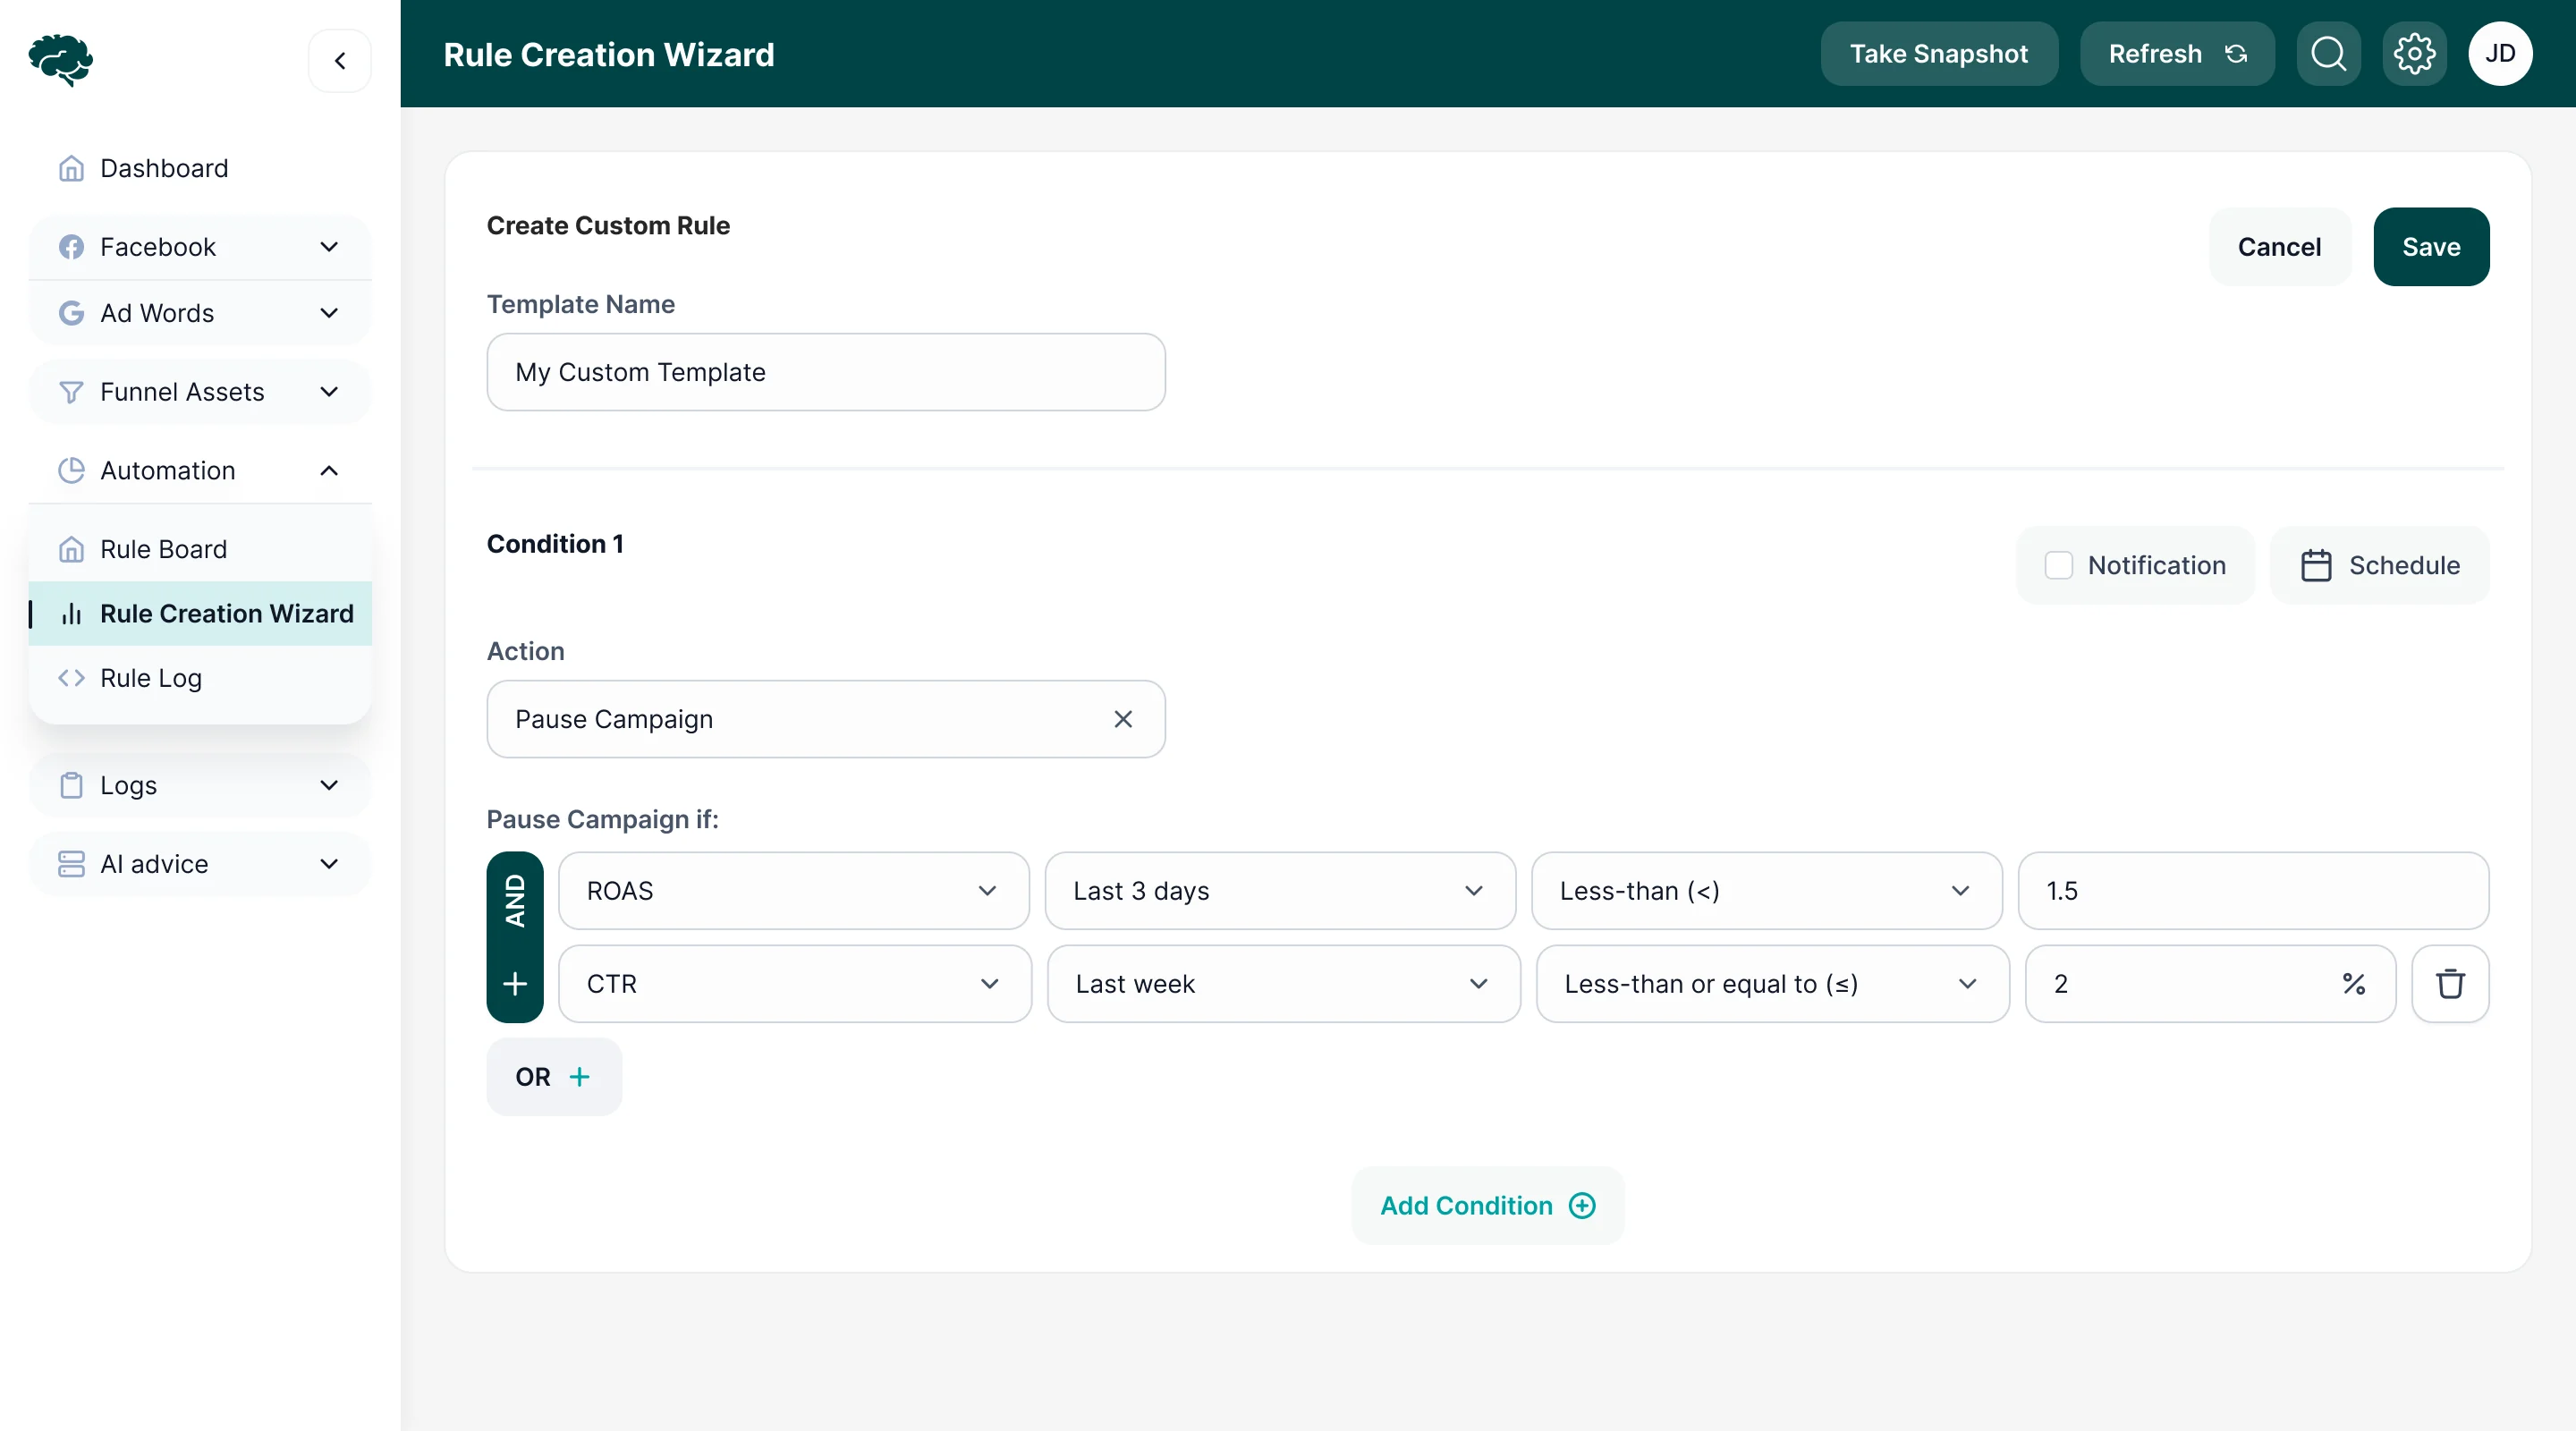
Rules that act in the open
- Found
- Rules pause campaigns and move budget while nobody watches, and a rule that fires unseen is one nobody trusts.
- Decided
- A rule board with what fired and what it did, a feed of triggered rules with the condition behind each, a builder that writes conditions as plain AND and OR rows, and a log that opens a rule’s history beside its data.
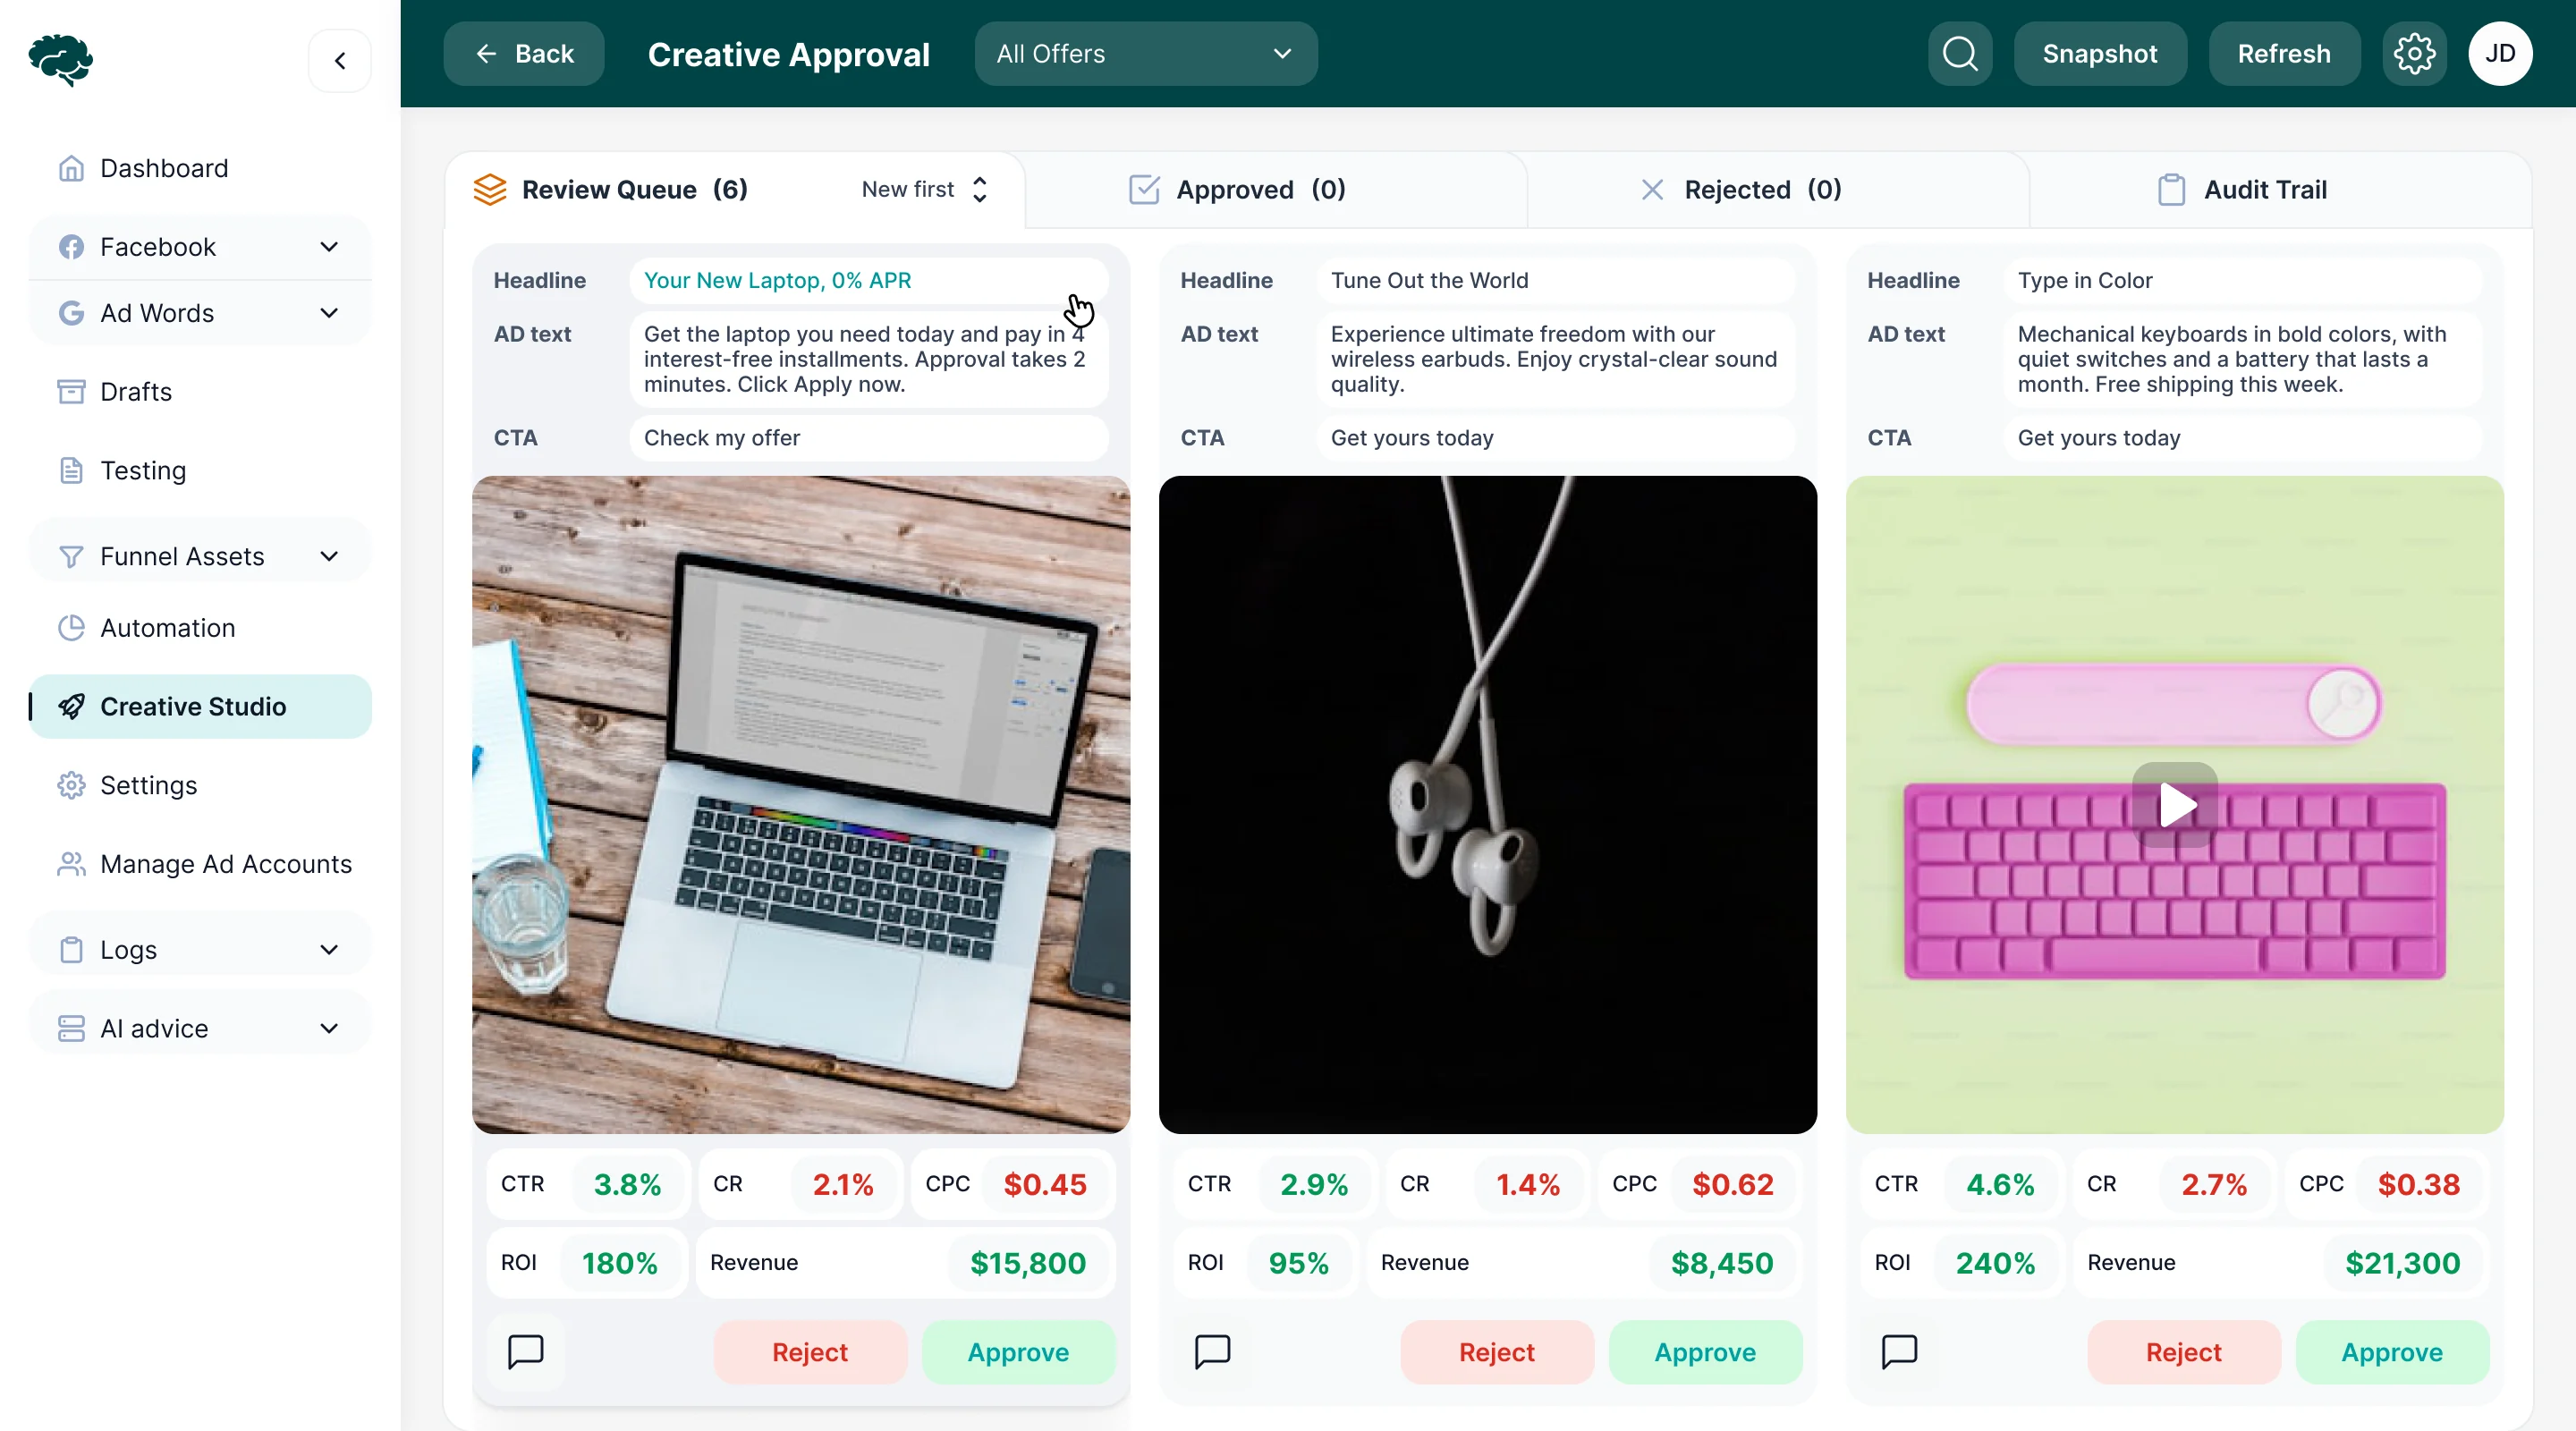
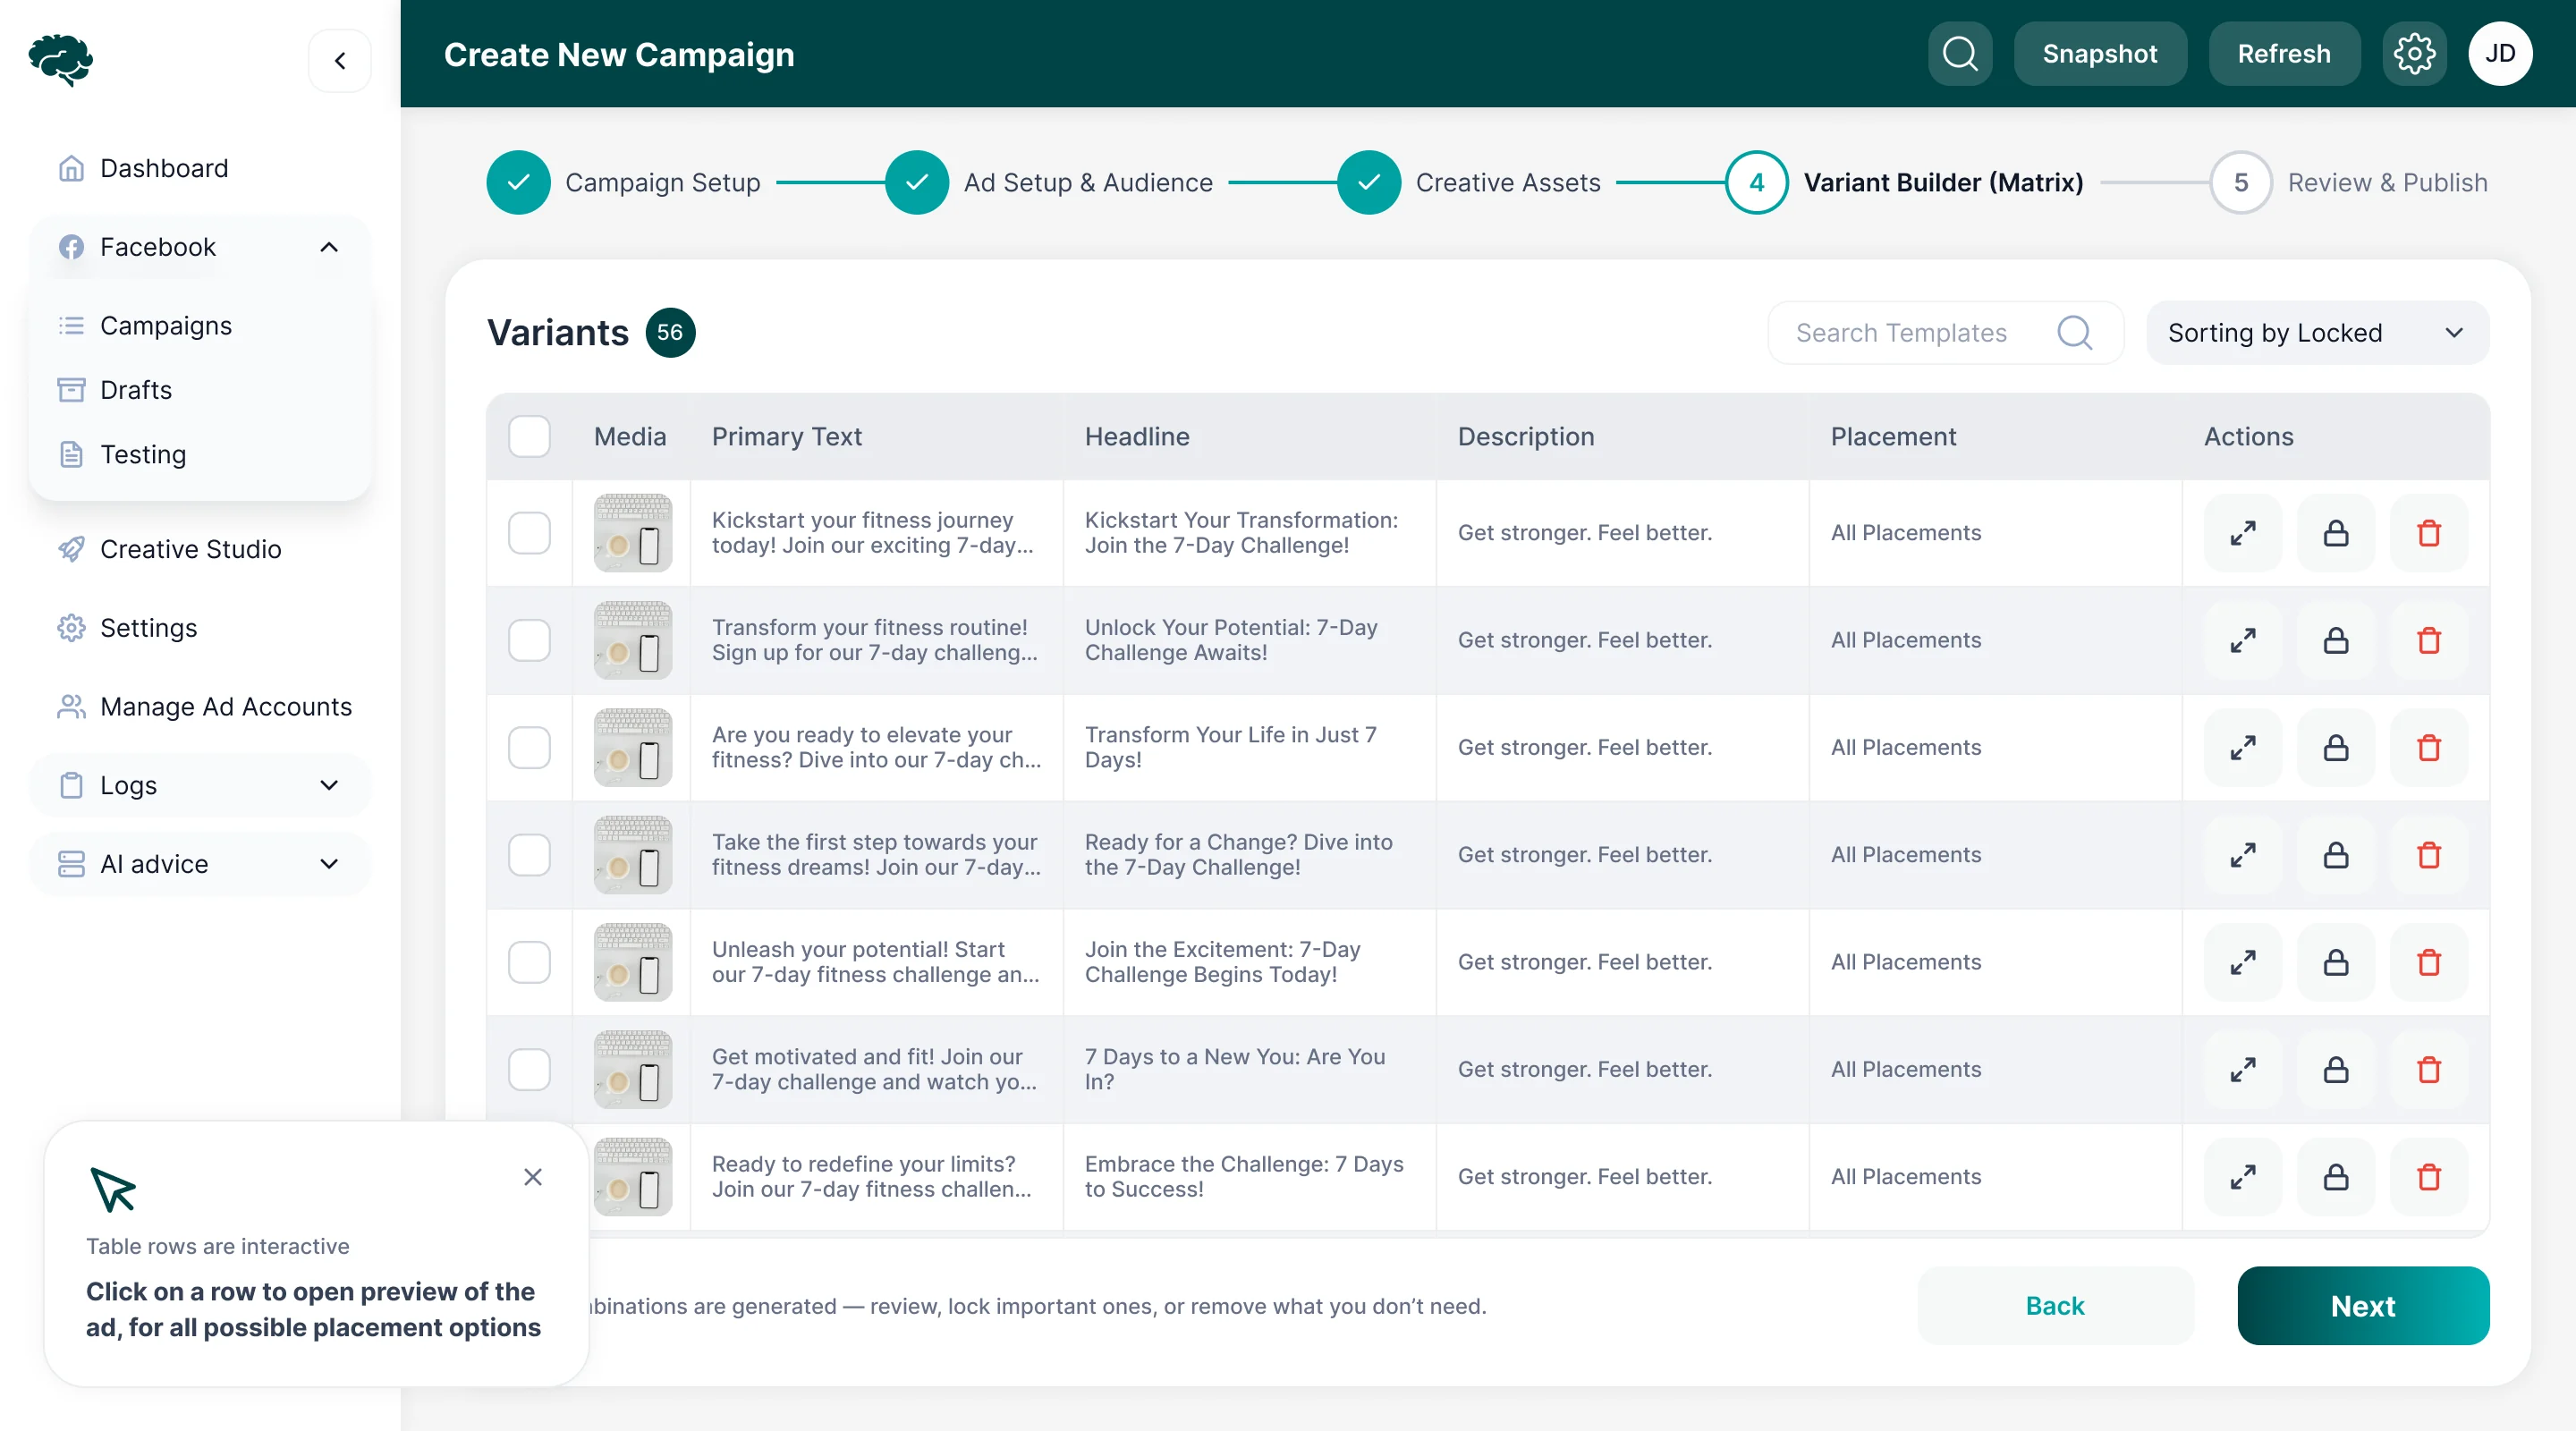
Approving creatives, then launching campaigns
- Found
- Creatives were approved in chats and campaigns put together by hand, one variant at a time.
- Decided
- A review queue that shows each ad with its copy and its numbers before anyone approves it, and a campaign builder that turns approved assets into every variant to check before launch.
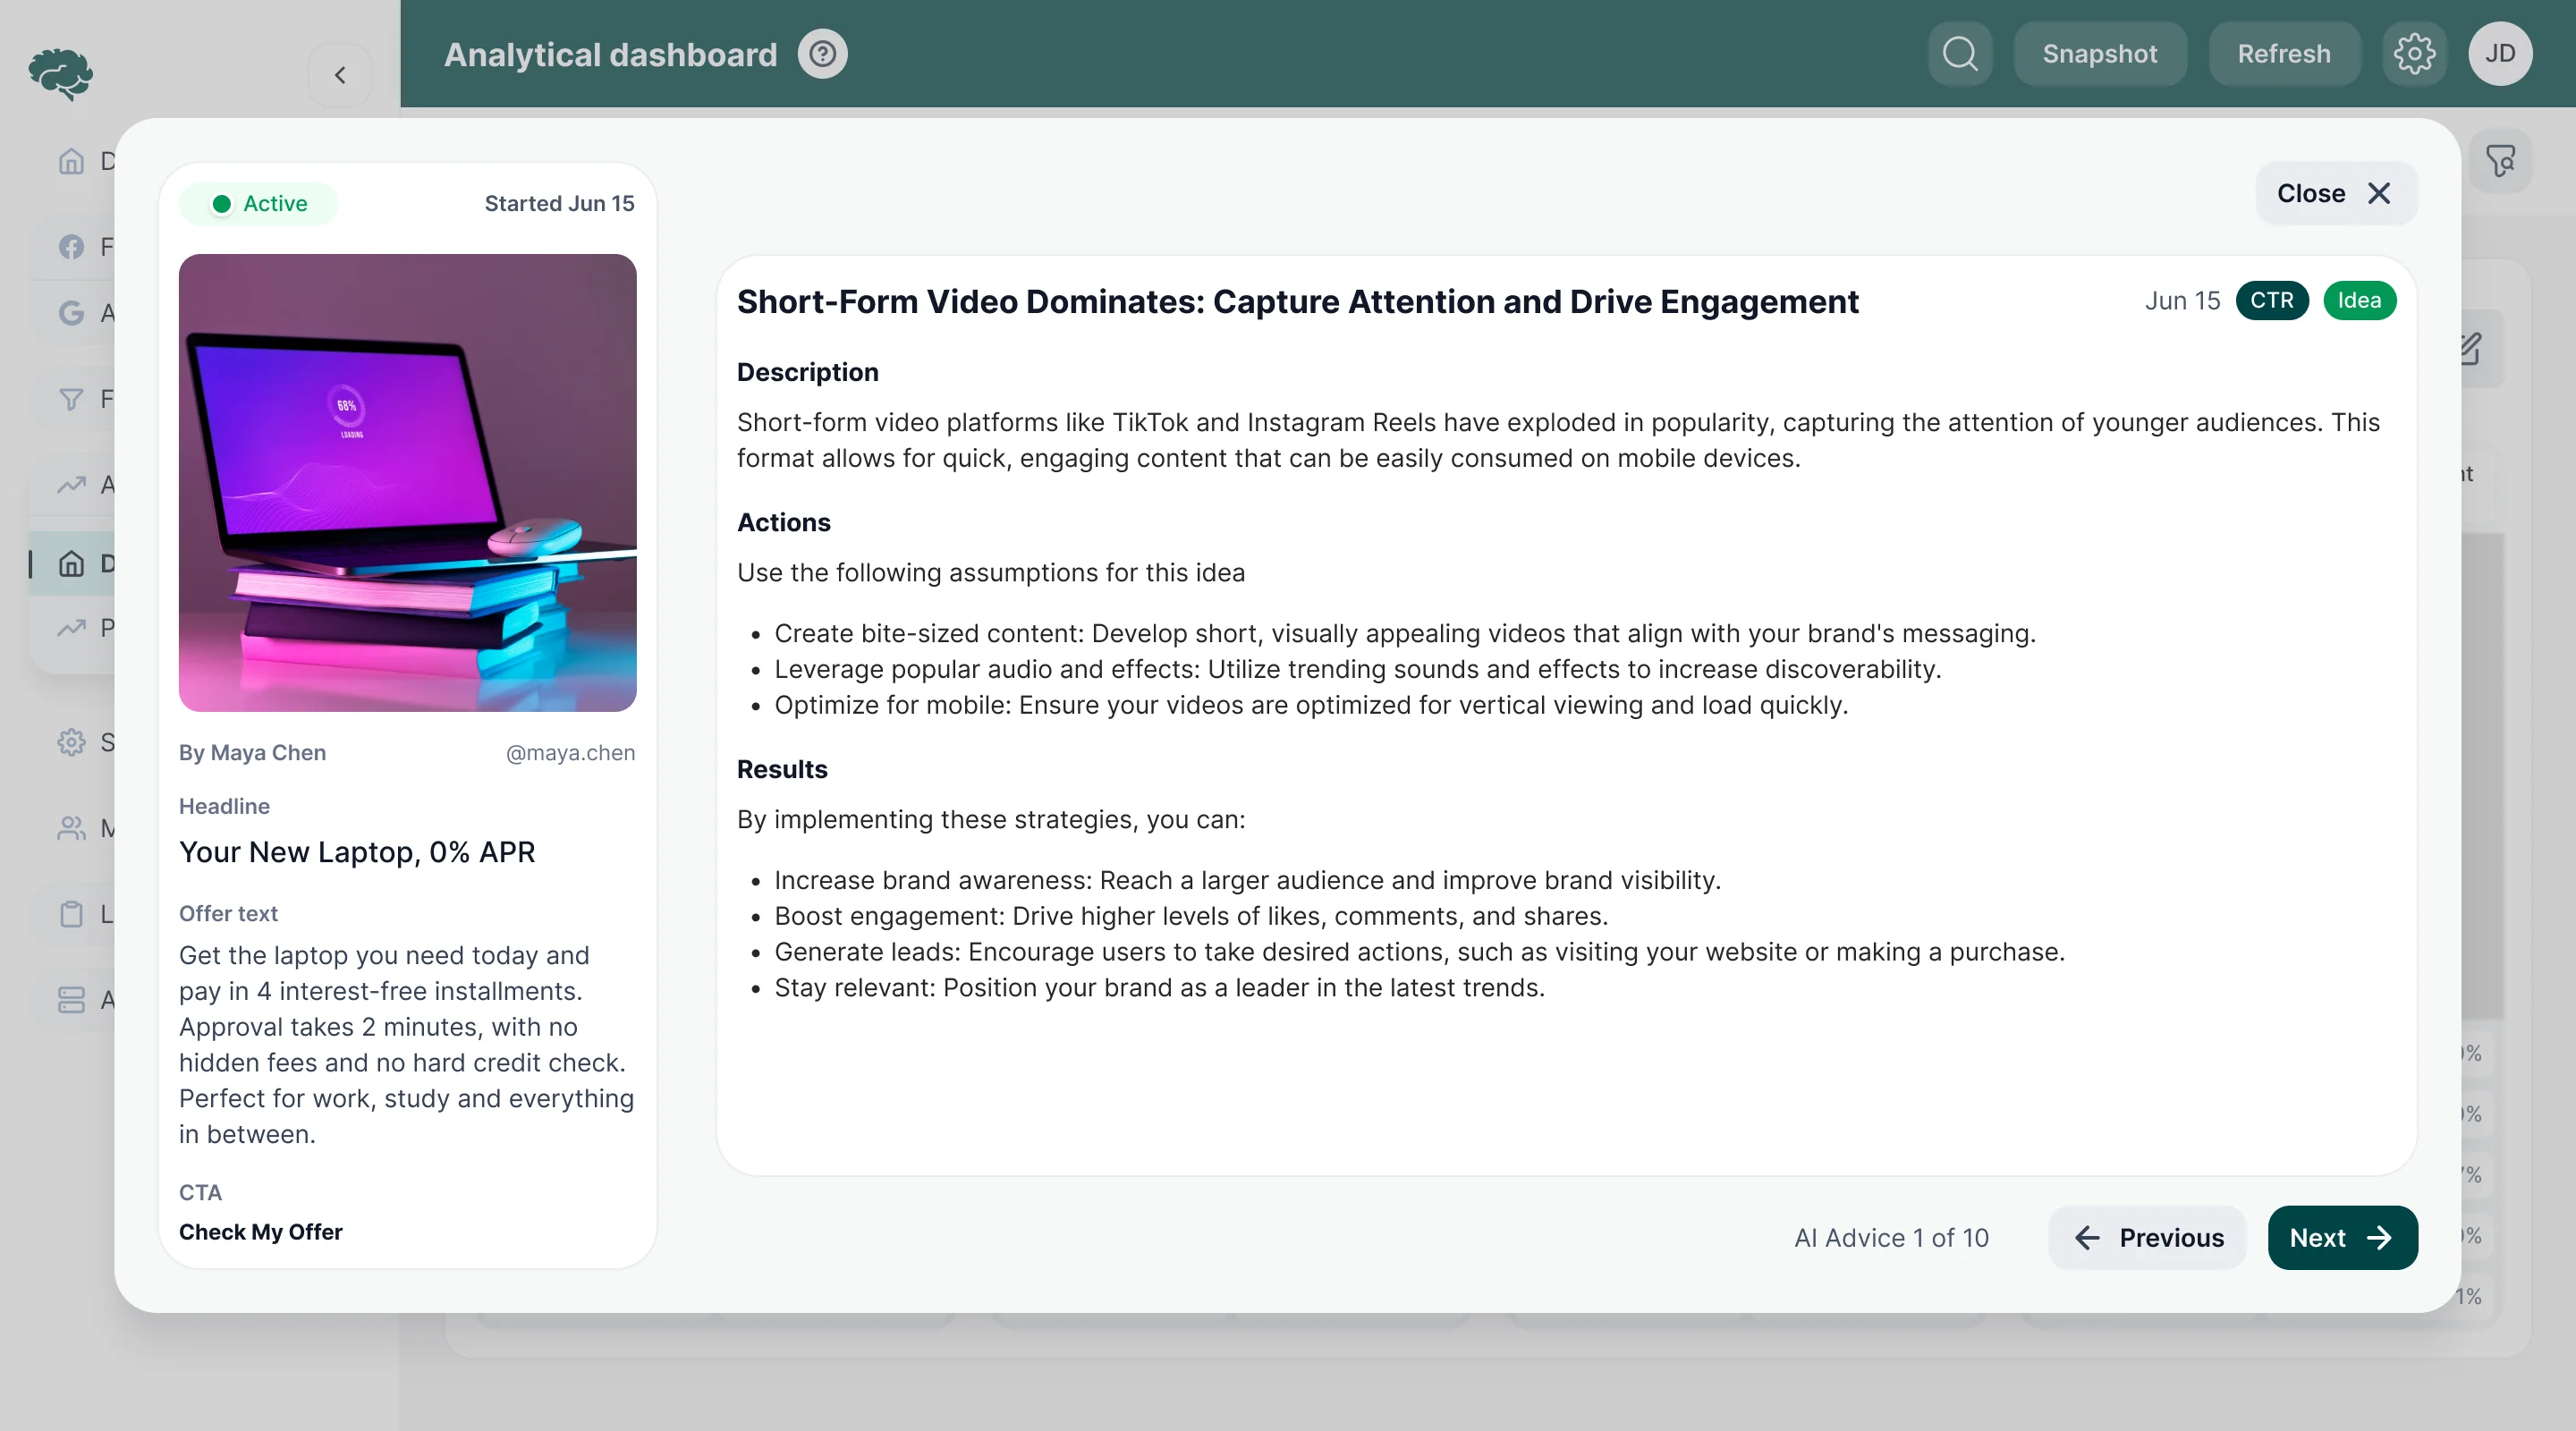
AI signals inside the workflow
- Found
- Trends and anomalies were found late, by whoever happened to look.
- Decided
- An AI feed on the dashboard for trends, anomalies, insights and alerts, and advice cards that explain an idea, the actions it suggests and what they can change, opened from the ad they concern.
One interface system across 400+ screens
- Found
- Eleven modules, each with its own filters, tables and charts, drifted apart as the product grew.
- Decided
- One component system: the same metric card, filter bar, chart block and table everywhere, each drawn for empty, filtered-out and broken data too.
A number reads the same everywhere
Value, period and change against the prior period, whether it is the dashboard’s ad spend or a lead’s lifetime value.
-

Dashboard: Six headline metrics for the period. -

Lead disposition: Lifetime value, revenue by advertiser and lead status.
Drawn for real data, not the demo
When numbers are missing, filtered out or wrong, the screen says so and offers the next step.
-
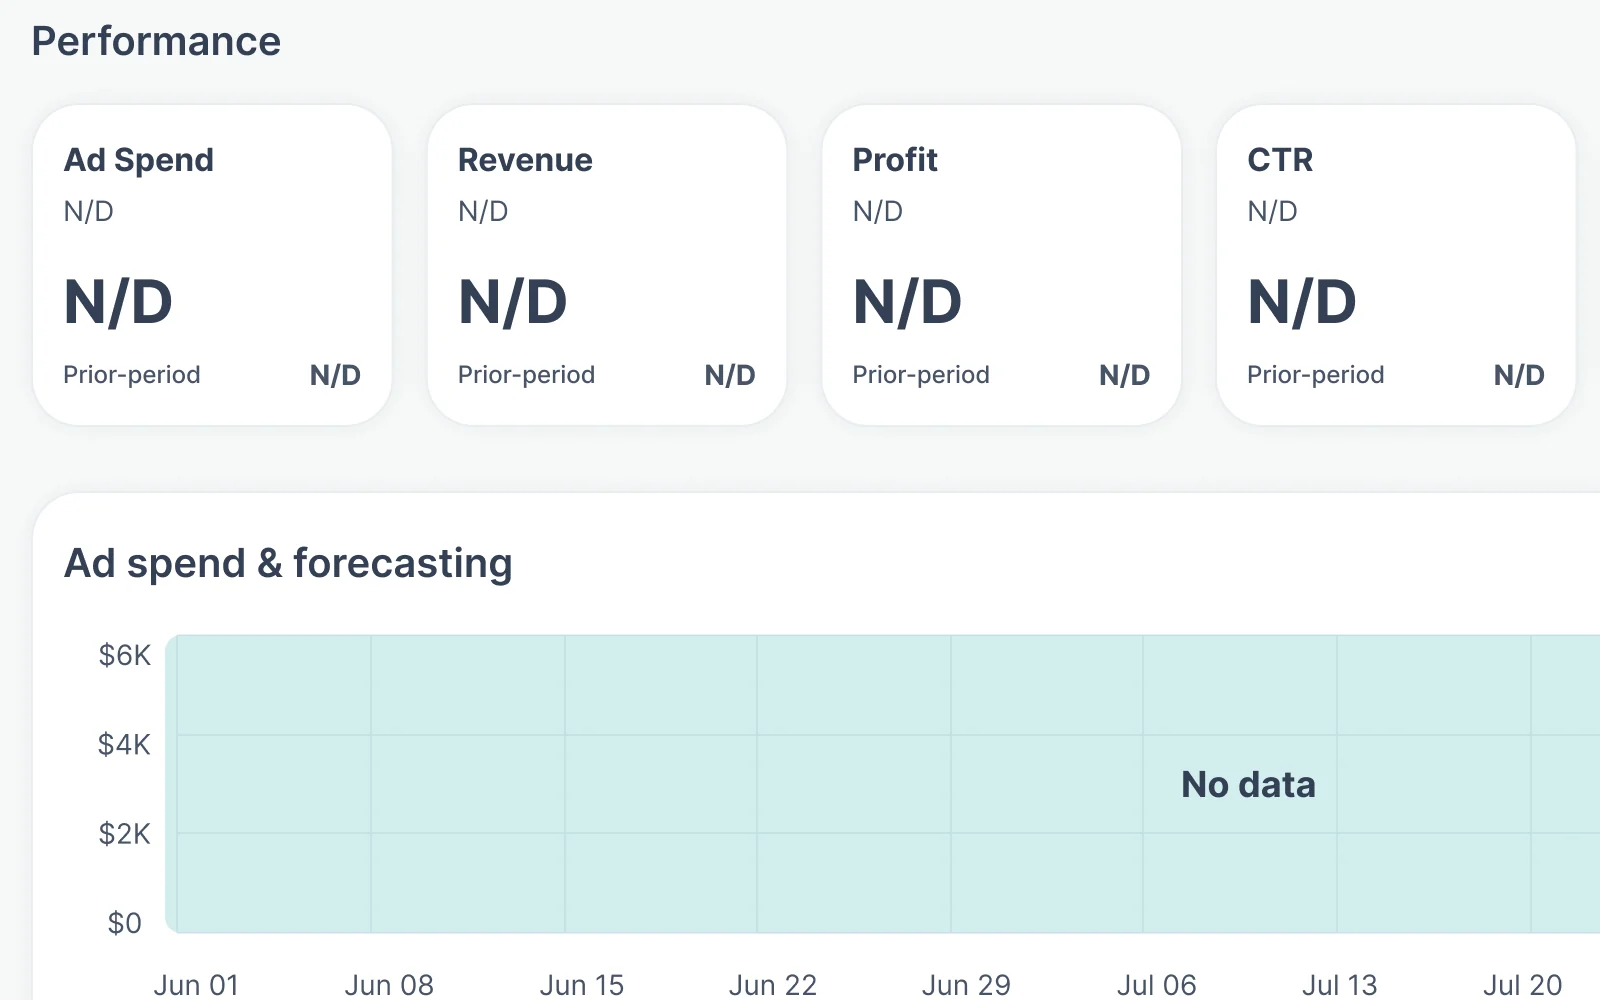
No data yet -
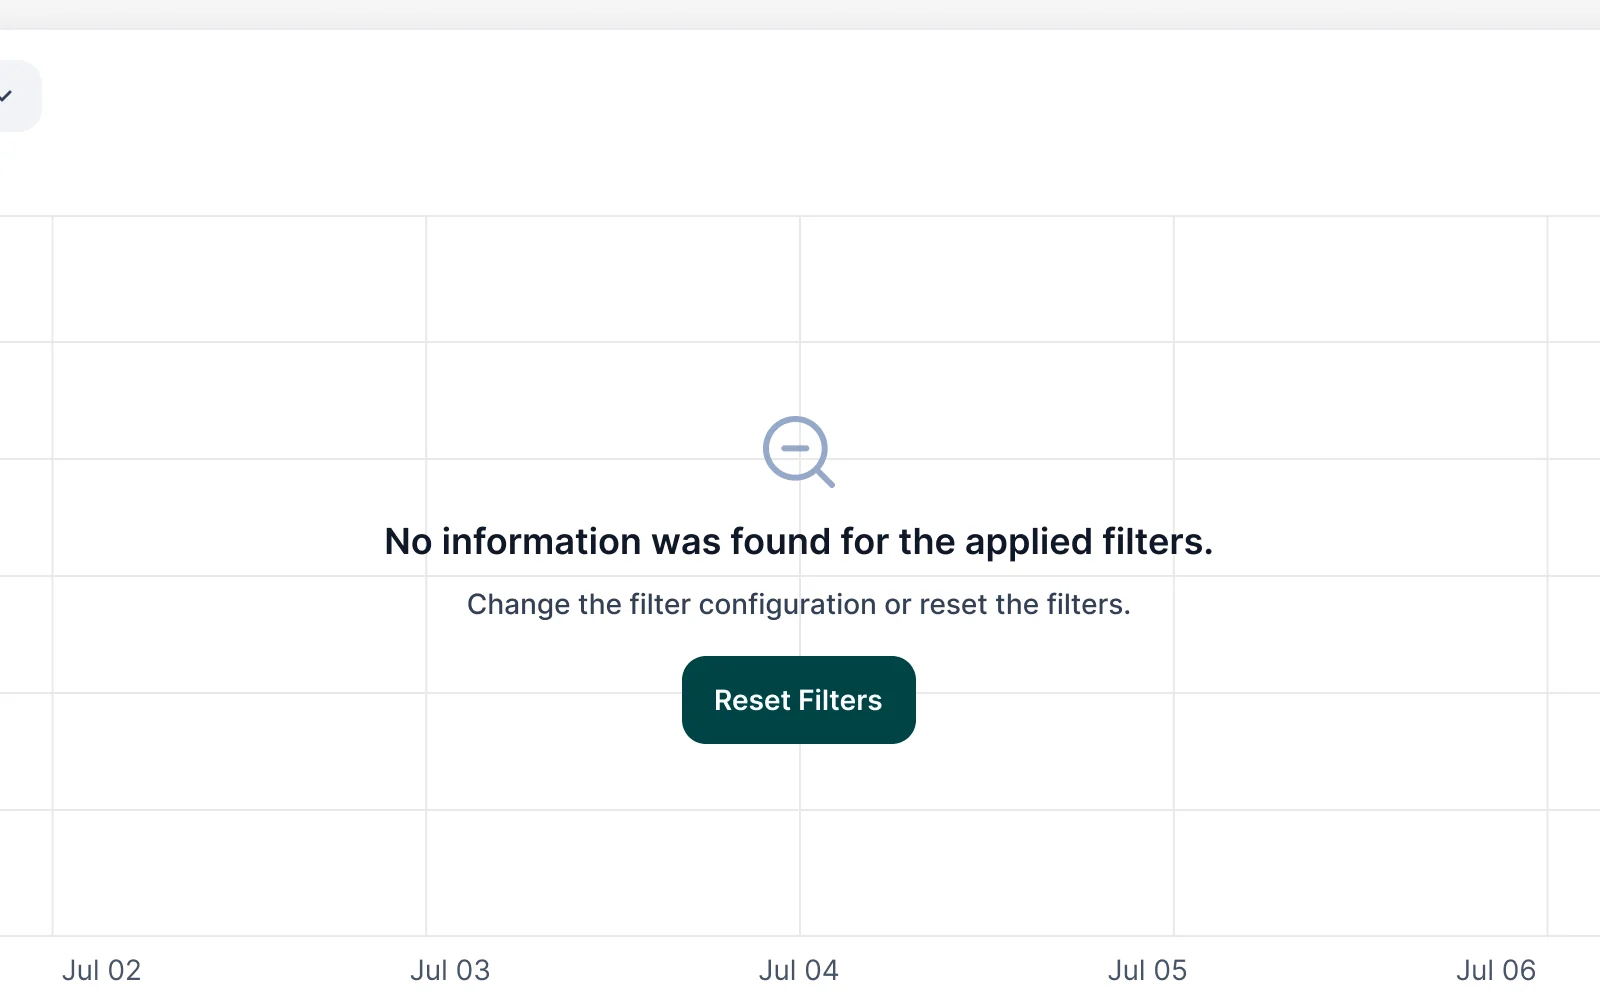
Nothing matches -
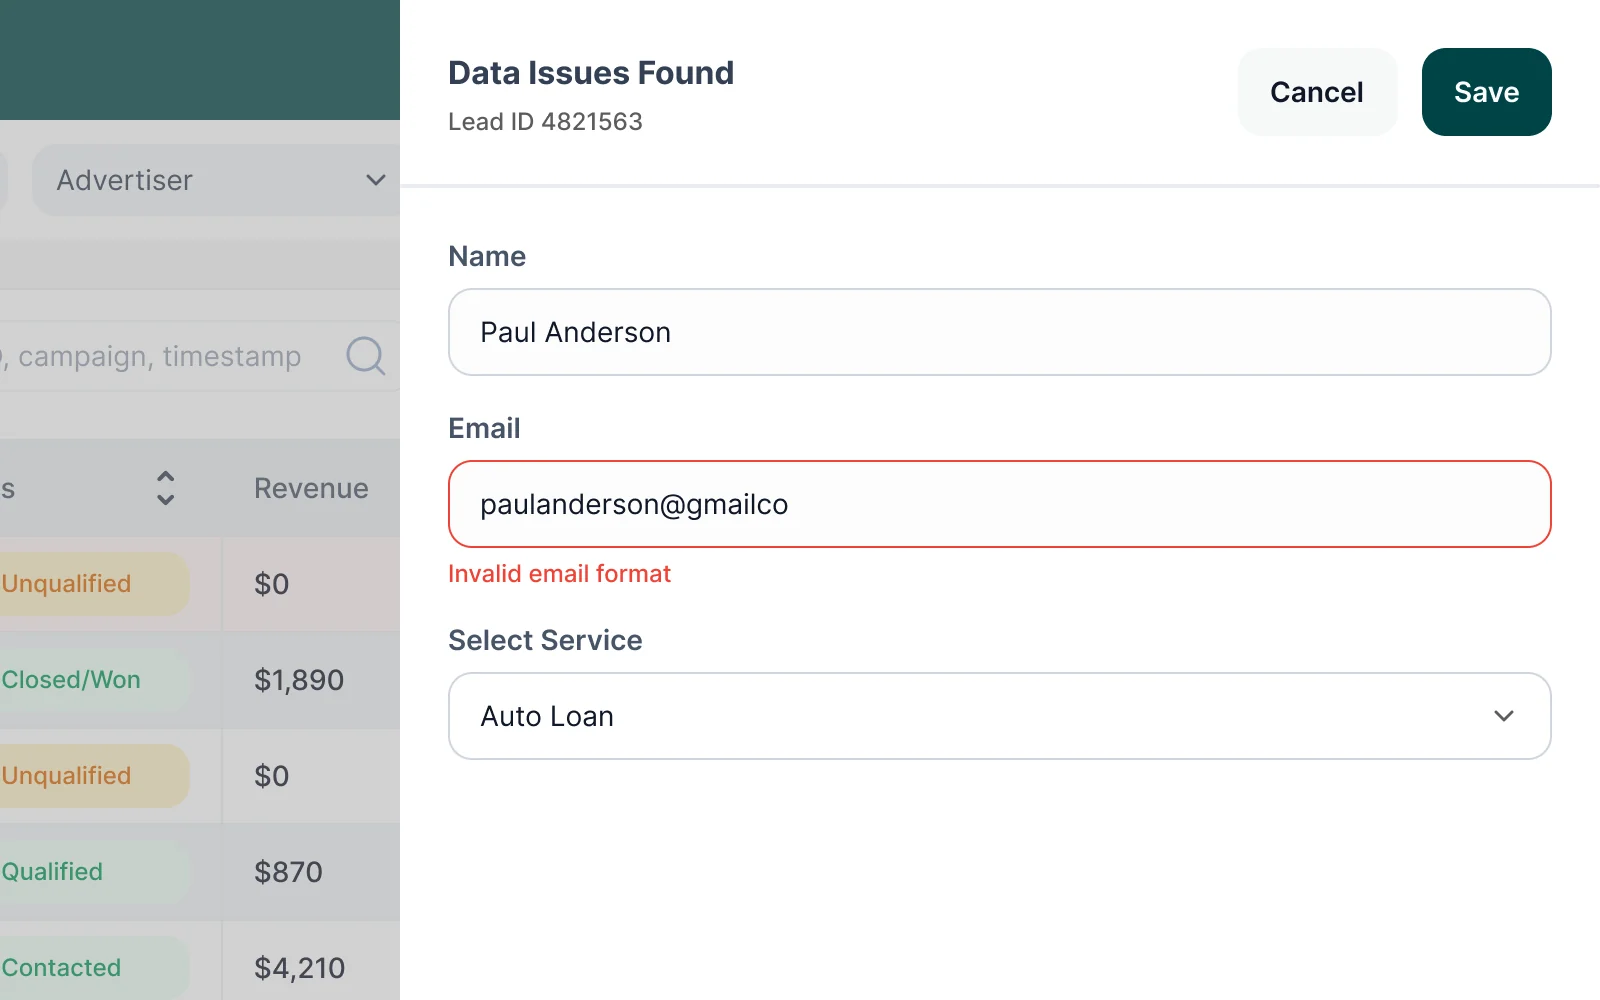
A lead with bad data
Where the product ended up
One system across the platform: performance with a reading order, leads followed from click to sale, rules that show their work, creatives approved and launched from the same place, and AI signals where the buyer already looks.
17 hours saved every week Daily analysis down from 45 minutes to 20, across eight media buyers
- screens and states
- 400+
- modules approved by the client
- 11
- experts on the team
- 4
In the client's words
ANODA helped organise a dense analytics product into a design we could review module by module. The comparative views and shared interface patterns gave us a clearer basis for discussing how the platform should present complex marketing information.

Afraid designers won’t read your numbers?
Spend, attribution, funnels, creatives: we learned how Concussion Media’s buyers decide before drawing a screen. Bring us your dashboard, and we’ll come back with its reading order.
More work like this
Three more products with dense data and specialist users.
-
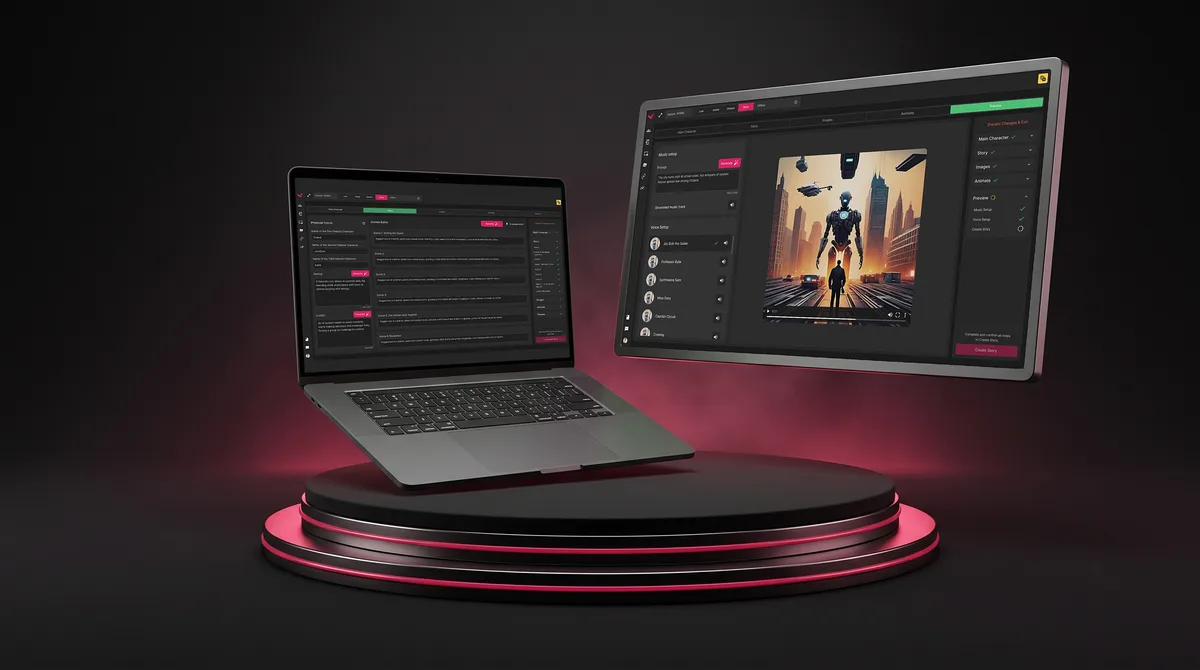
SaaS · Live Events
Vixi Suite
Untangled multi-step admin workflows for live events into one web platform: moderation, output pages and a graphics tool, mapped flow by flow.
- 200+ Screens designed
- 4 Experts on the team
-
AI Hi-Tech · SaaS
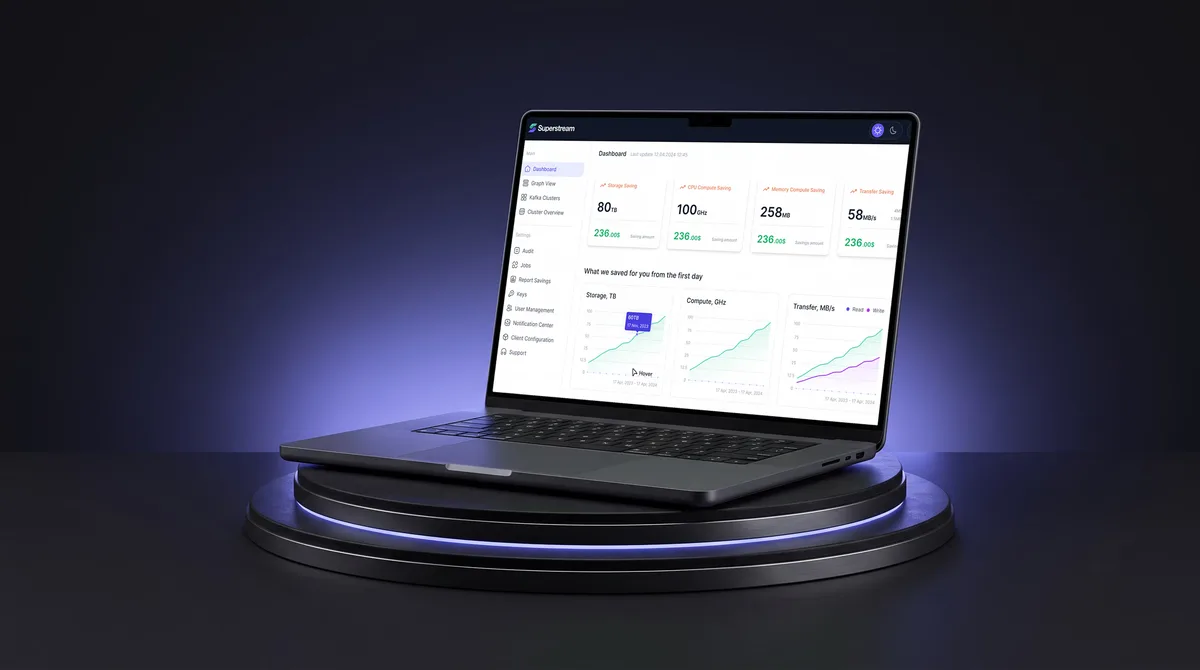
Superstream
Turned a Kafka management platform’s dense technical data into one calm, consistent interface for DevOps teams.
- 3000+ Screens designed
- 1500h+ Design hours
-
Sales training · Desktop web platform
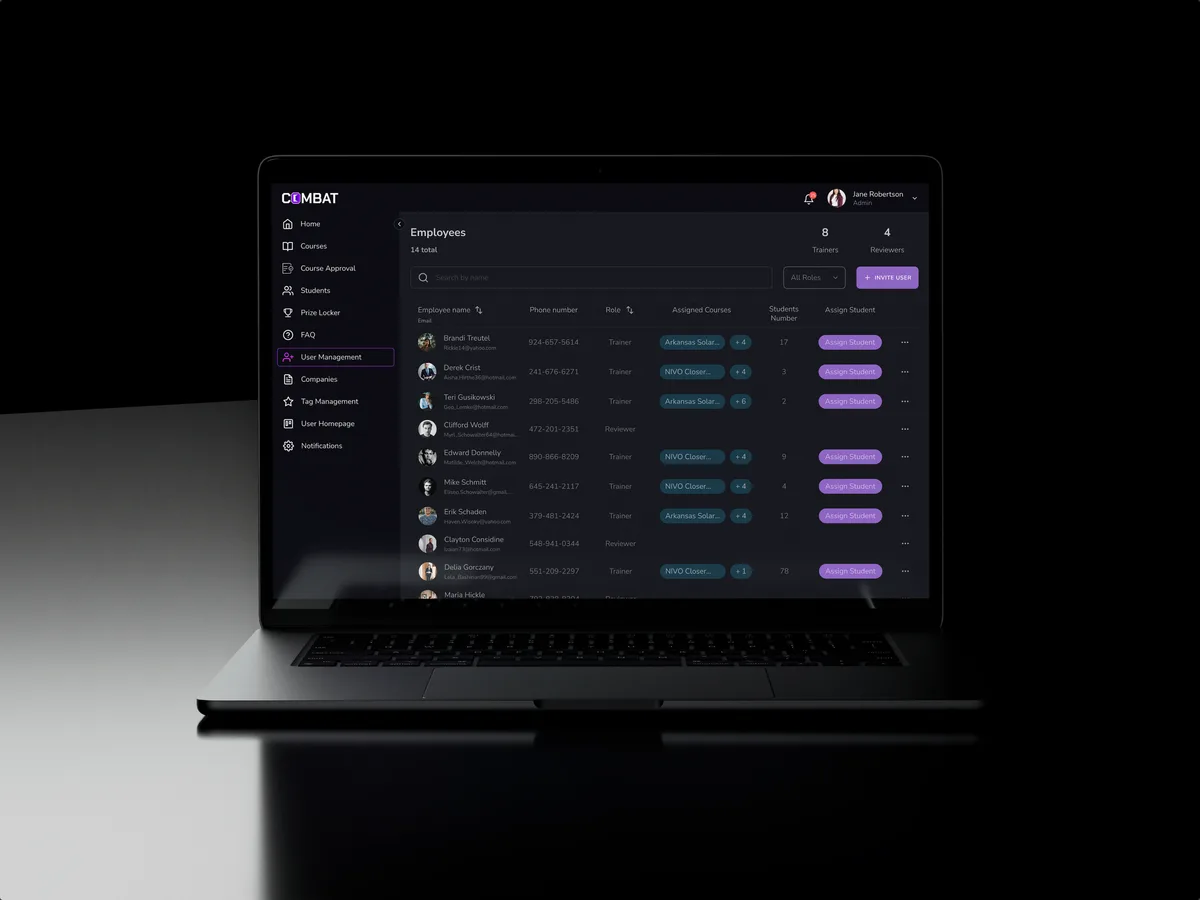
Combat Sales
Redesigned selected areas of a desktop sales training platform for five roles — Student, Trainer, Reviewer, Company Administrator and Superadmin — in the look they already knew.
- 80+ Final desktop screens and interaction states
- 5 Roles in one platform
What we brought to Concussion Media
The product
- Marketing analytics design Performance, attribution and funnels in one reading order.
- Marketing automation design Rules, triggers and a log of every action.
- Creative management design Creative review and approval inside the workflow.
- SaaS product design A multi-module product teams work in every day.