
Information Architecture in UX: A Practical Guide
Learn how to create information architecture for digital products: content inventory, taxonomy, navigation, card sorting, tree testing and iteration.
Design the consoles engineers use to connect, watch and fix their systems — so the first setup works, the right signal stands out, and an incident reads in minutes.

Technical products engineers can set up, read and debug, without a wall of numbers or a trip to the docs.
One screen of charts and figures for the people who monitor.
Developer Tools & Infrastructure UX
The whole tool engineers configure, watch and debug in.
Not included
Developer tools go wrong when screens mirror the back end. The design starts from what engineers do — connect, check, investigate, change — and shows the system in that order.
Setup, daily checks, incidents and admin, per role — from the first connection to on-call.
Connecting a first cluster, key or integration, with validation and a clear error at every step.
Overviews, graphs, tables and logs, ordered so what is wrong surfaces first.
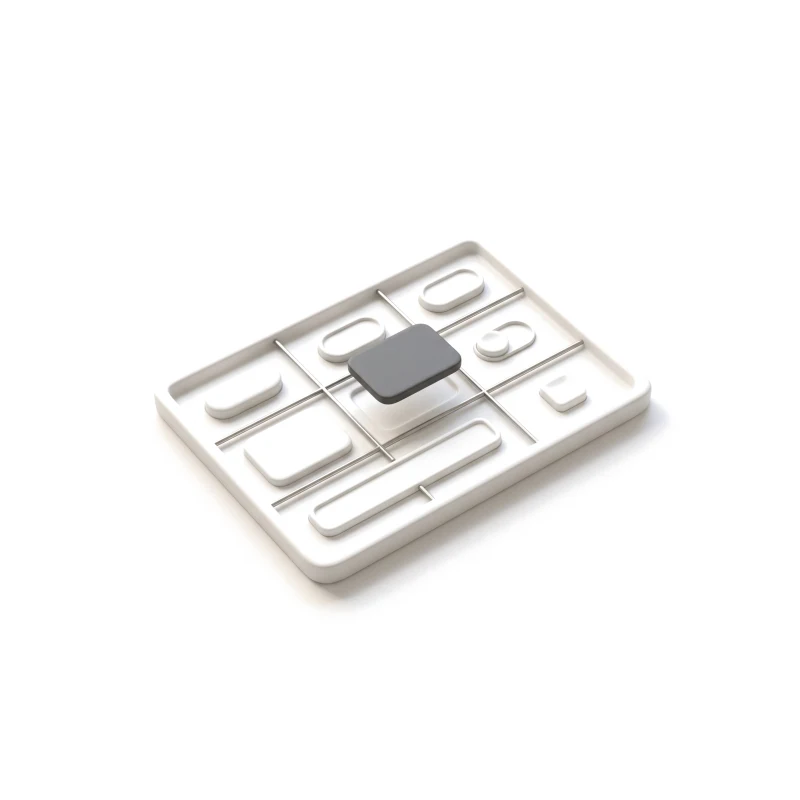
Tables, code blocks, statuses and dark mode, as one set of parts every view shares.
You receive
Developer experience design is tested when something breaks. Every screen is drawn for the quiet day, the noisy alert and the half-loaded metric, with the detail one click away and never hidden.
A Kafka management platform for DevOps teams and a bug tracker engineers know by heart.
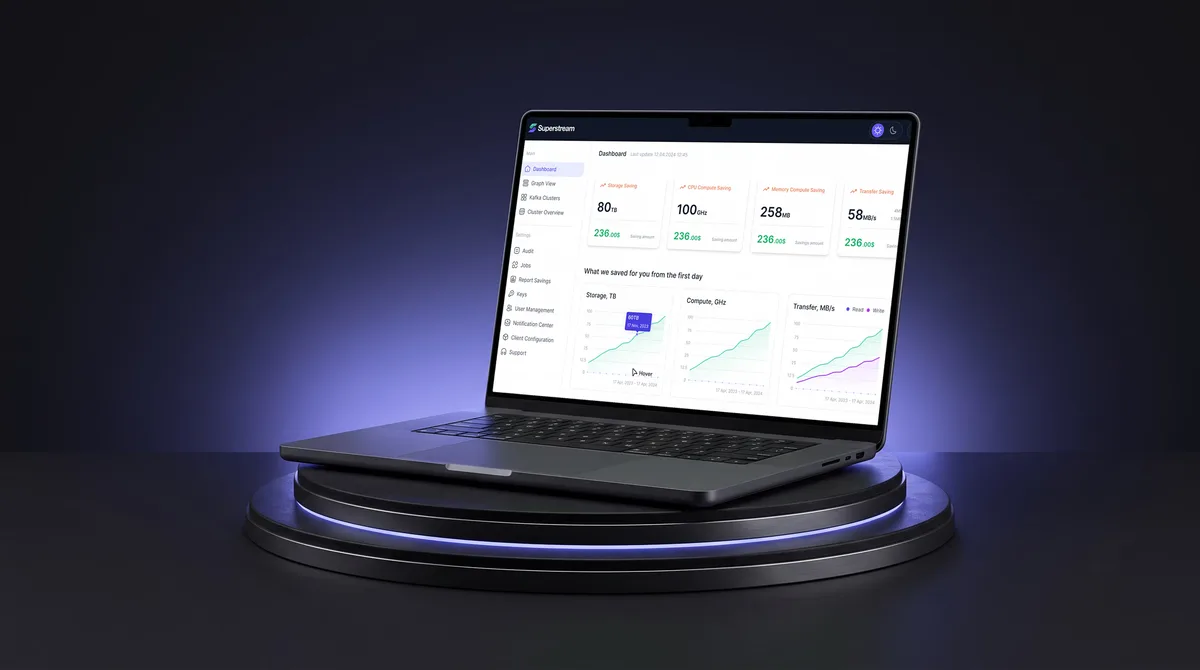
AI Hi-Tech · SaaS
Unified clusters, optimizations and users — dense Kafka data — into one calm, responsive system for DevOps teams, with a dark mode that keeps the data readable.
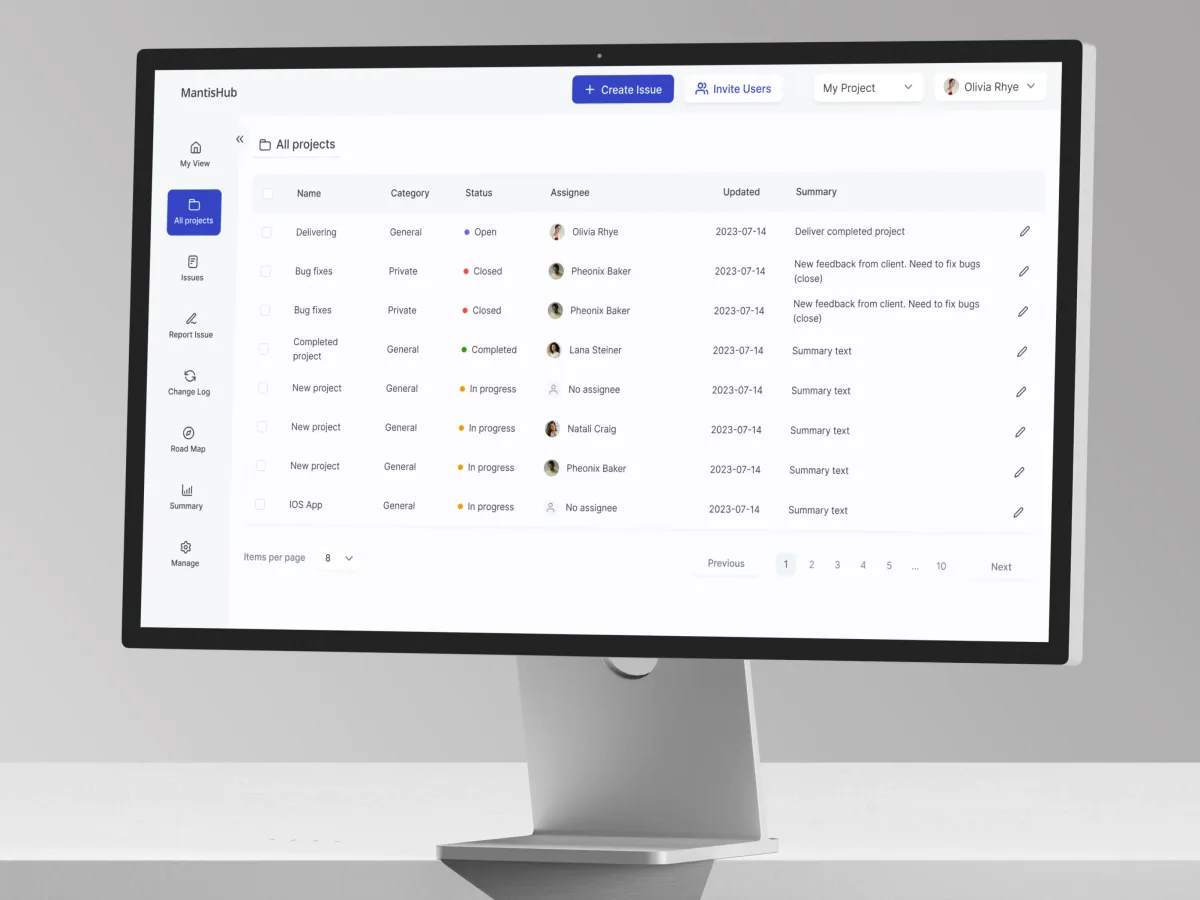
DevTools · Bug tracking · Web SaaS
Redesigned selected MantisHub issue workflows — lists, filters, issue details and notes — keeping the density its long-time users rely on.
It fits when engineers are the users, and the product is how they run their systems.
They judge the tool in minutes and fall back to the CLI if it wastes their time.
Metrics, logs, configs and states that change by the second.
Connecting the first cluster, key or integration takes too long.
Each module has its own tables, statuses and patterns.
A different starting point
Tell us what the tool does and where engineers get stuck. We will come back with the service that fits and a realistic next step.
Developer tools are usually designed a workflow or a module at a time, through the service that matches the tool's stage. Its proposal sets the terms.
Tell us what the tool does, who uses it, and which step sends people back to the CLI.
Message received.
Within 15 minutes, we’ll email you initial feedback and follow-up questions.
Learn how to create information architecture for digital products: content inventory, taxonomy, navigation, card sorting, tree testing and iteration.
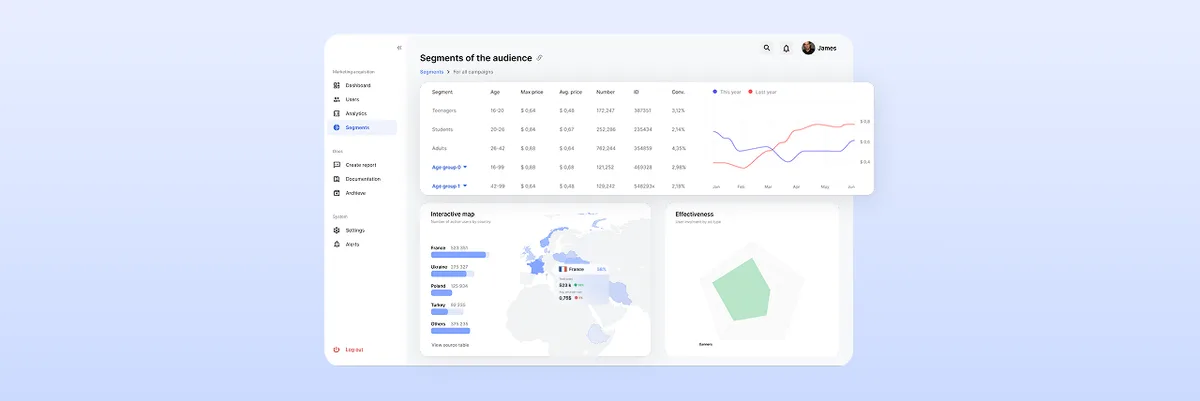
Learn the best dashboard UI design practices to enhance user experience. Improve data visualization and usability. Get expert insights at ANODA UX Agency today!
Ask to see a technical product designed end to end: a setup flow with its errors, a dense table at real volume, an overview that ranks what is wrong, and the states around them. Ask whether the team spoke to the engineers who use the tool, how it treated dark mode and data density, and what it left unchanged in a product people already know. Our Superstream and MantisHub cases show both a new system and a careful refresh.
A map of who uses the tool for what, the setup and onboarding flows, observability and diagnostic views, the UI as a clickable prototype, and a component kit. The work grows with the number of modules and roles, the density of the data, whether dark mode and tablet are in, and how much of today's tool stays as it is. They are set in the proposal for the service you start with.
Platform and DevOps engineers who connect and configure, developers who check their own services, on-call engineers who investigate alerts, and admins who manage keys, users and billing. The workflows are the first connection, reading an overview, drilling from a spike to the cause, changing a setting safely, managing access, and reviewing what changed and who changed it.
A UX Audit shows where engineers struggle in a live tool; Product Redesign gives a well-known tool a new surface without moving its controls. UI/UX & Product Design fits a new developer product built from scratch, Web App Design the console, Dashboard Design a single monitoring screen, and Design Systems the parts every view shares. UI Design carries the visual layer when the structure already works.
With the workflow, not after it. Every screen is drawn for nothing connected yet, a connection being validated or failing with its reason, all healthy, an alert firing, an expired key or denied access, stale or partial metrics, a risky change waiting for confirmation, and thousands of rows under one filter. Roles decide who can change what, and dark mode is designed for readability, not inverted.
Staging access with realistic data and a test account per role, time with the engineers who set the tool up and get paged by it, a product owner who can decide what the console does, and the engineers who know what the back end can report and how fast.
Superstream, a Kafka management platform for DevOps teams — 3000+ screens designed and 1500h+ design hours by 4 experts. MantisHub, the hosted issue tracker built on MantisBT — 52 screens by a team of 3. The case studies show how dense technical data was made readable.
Yes. Most developer tools are live, and their users have habits worth keeping. On MantisHub we redesigned selected workflows and kept the dense lists and filters experienced users depend on. We work in your files and components, review with the engineers who use the tool themselves, and hand over the kit the console is built from.