
Marketing attribution CRM, first click to order
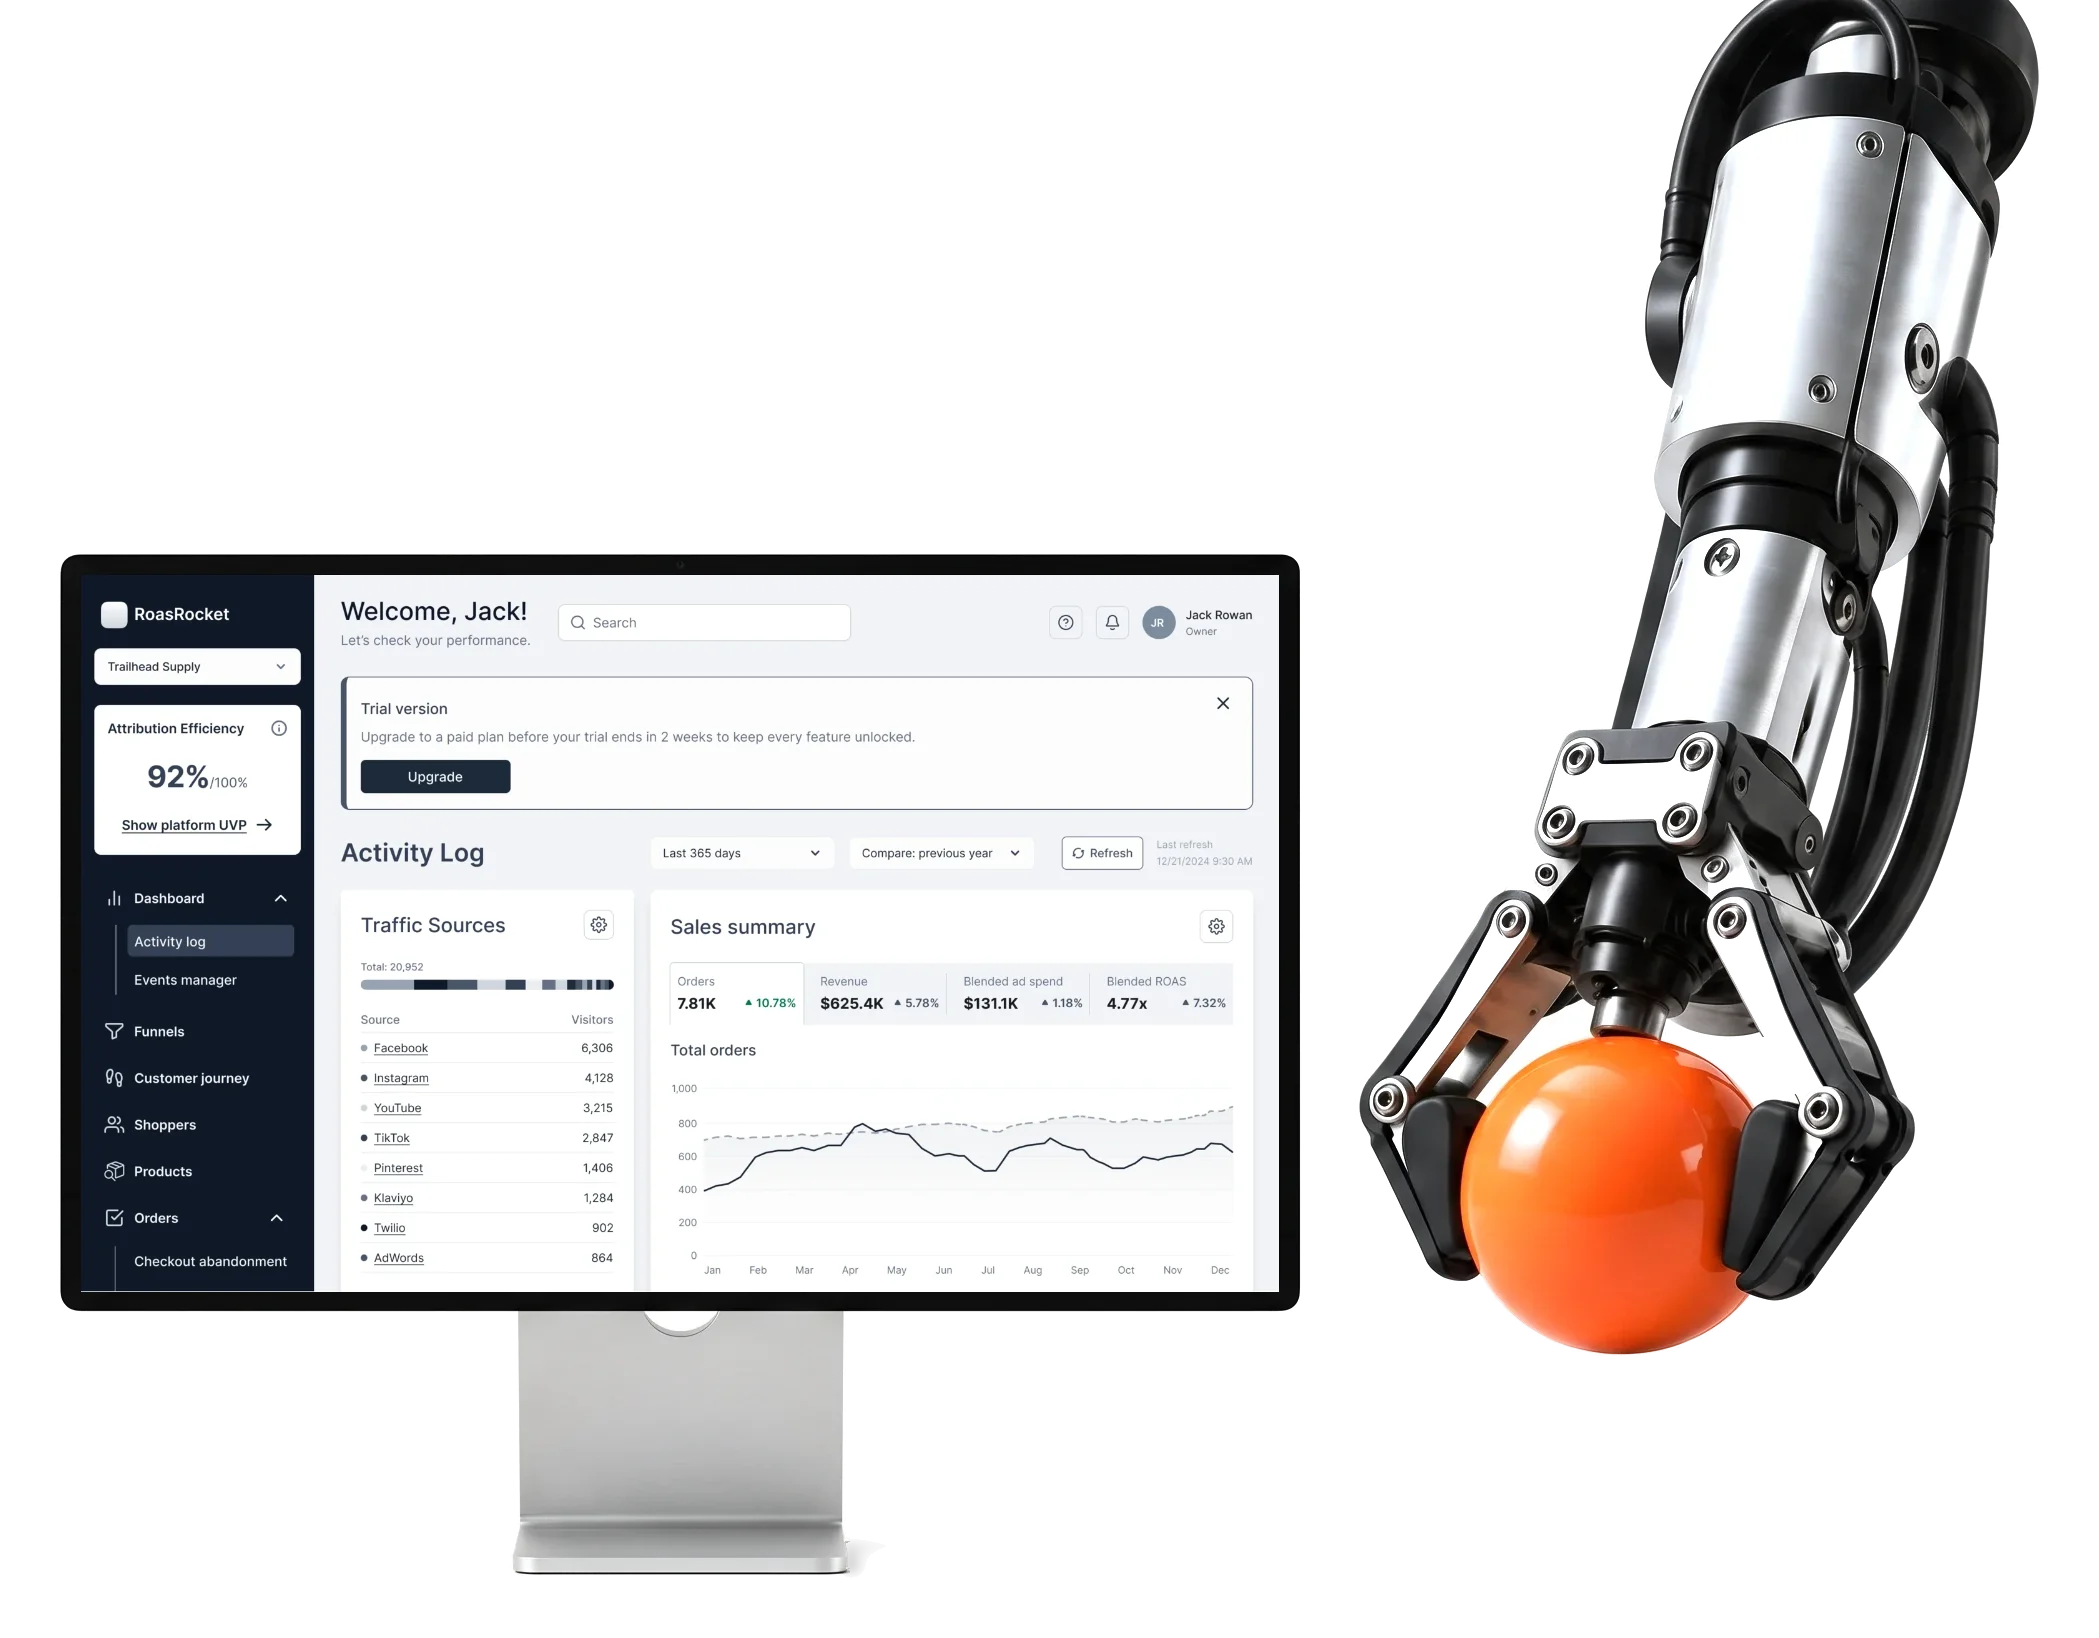
RoasRocket is a marketing attribution CRM for performance-marketing teams.We redesigned an incomplete legacy reference into a full desktop product.
- 148
- screens from sign-up to checkout, at 1440 px
- 13
- workflows analysis, audiences, connections, store and account
- 3
- experts on ANODA’s side, handing over to the client’s developers
Project summary
RoasRocket is a B2B marketing attribution CRM for performance-marketing teams, analysts, media buyers and ecommerce operators. We did an existing-product redesign as B2B SaaS product design , with a full design system and UI kit , a clickable prototype and screen maps, handed off to the client’s own development team.
What runs through RoasRocket
One chain, from a connected store to a decision about spend:
-
Setup
- Tracking gateway
- Domain and DNS
- Tracking script
-
Sources
- Stores and tools
- Custom sources
- Match rules
-
Events
- Activated events
- Event matching
- Attribution data
-
Analysis
- Activity Log
- Funnels
- Customer journeys
-
Audiences
- Segments
- Destinations
- Event workflows
-
Commerce
- Products
- Sales channels
- Orders
- Total and Evidence
- Every headline figure opens into the events and clicks behind it.
- Reading and Setting up
- The data and the setup that feeds it sit one click apart.
- Flexible and Safe
- Custom sources, events and segments built from rules, with conflicts flagged before saving.
The Activity Log, read top to bottom
- Found
- The first screen after sign-in gathers traffic, sales, the funnel and live events; with every block at the same weight, a marketer has nowhere to start.
- Decided
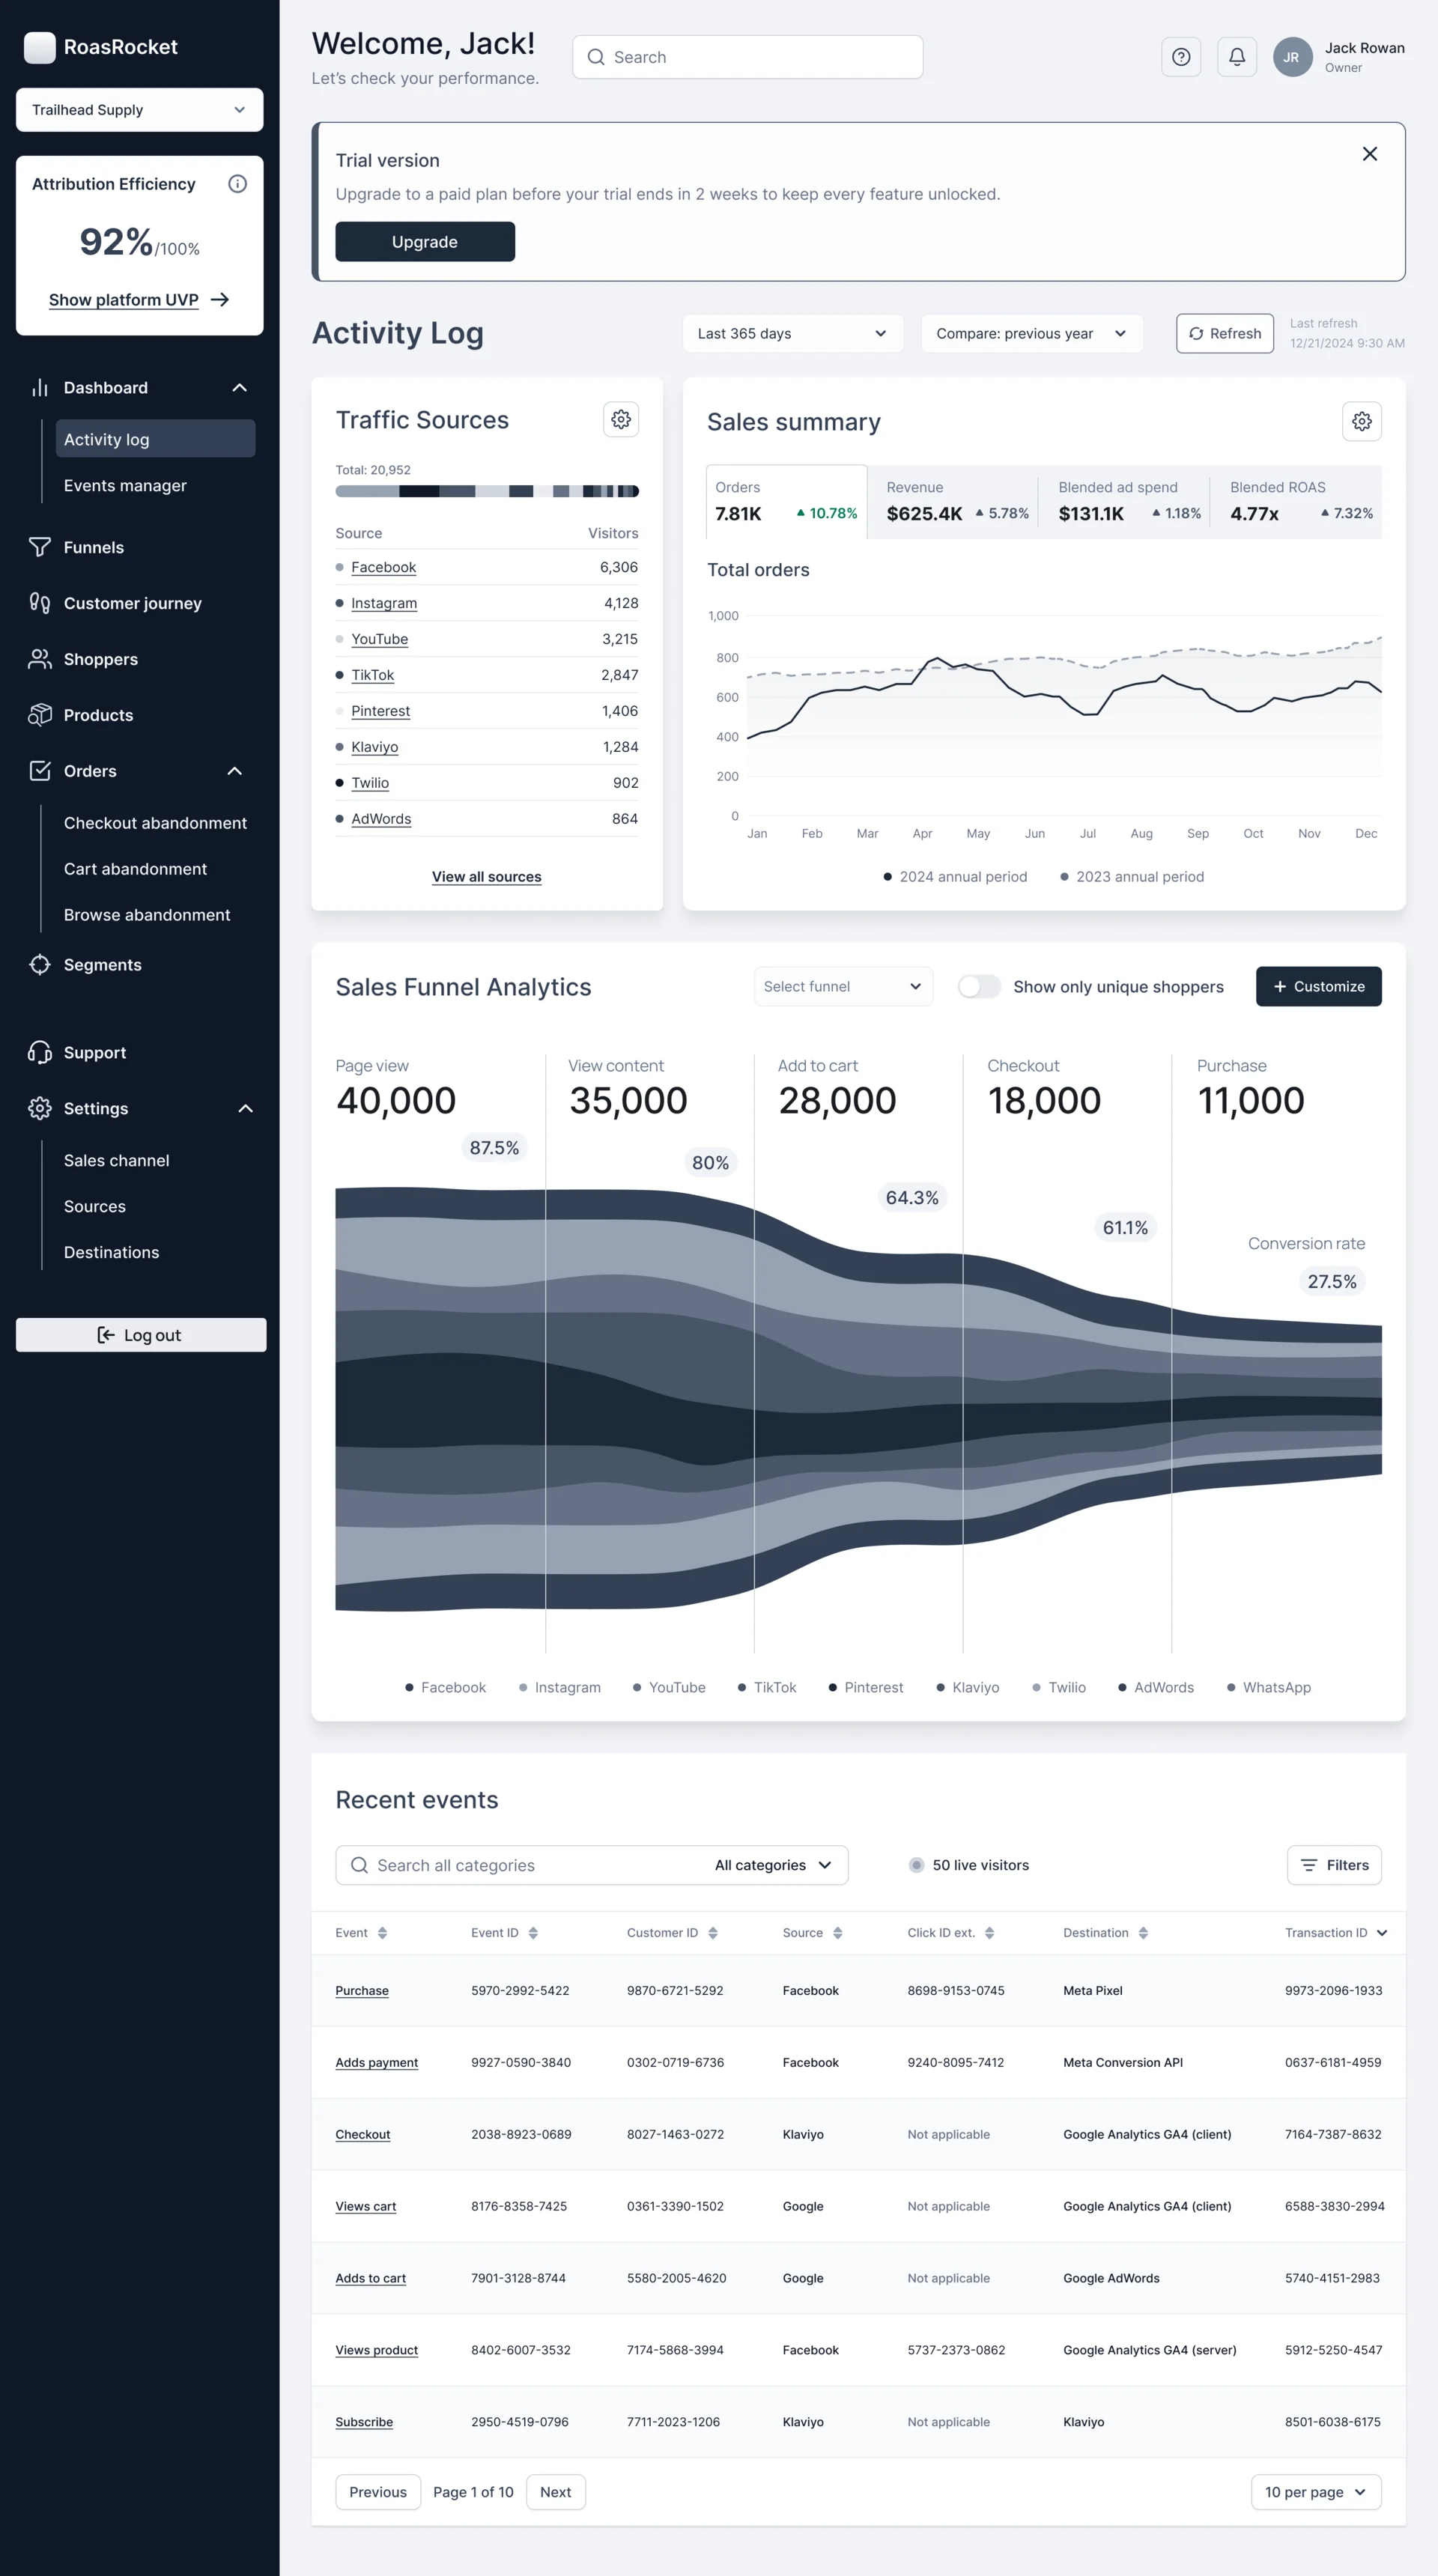
- A home in reading order: which brand is in view and how complete its tracking is, where traffic came from and what it sold, the funnel split by source, then the events behind every number.
- For the user
- A media buyer sees what sold and where shoppers dropped off before opening a single table.
-
Which brand, how well tracked
The brand switcher and the attribution efficiency score.
-
What came in, what it sold
Traffic sources next to orders, revenue, ad spend and ROAS.
-
Where shoppers drop off
Five funnel steps, each split by source.
-
The events behind it
Every event with its source, destination and IDs.
How the work progressed
Architecture and flows first, then wireframes, then the interface and its system, handed over with a prototype and screen maps.
-
User Flow
What the product had to hold beyond the legacy reference, and the path through each workflow
Artifact Information architecture and user flows, with every state marked
-
Wireframes
Where each block lives on dense data screens, before any visual decision
Artifact Wireframes for every workflow at 1440 px
-
UI & Design System
One look for analysis, setup and billing, and components that repeat instead of being redrawn
Artifact Final light-mode screens, a full design system and a UI kit
-
Delivery
What the client’s developers needed to build it without a call per table
Artifact A clickable prototype, screen maps and the development handoff
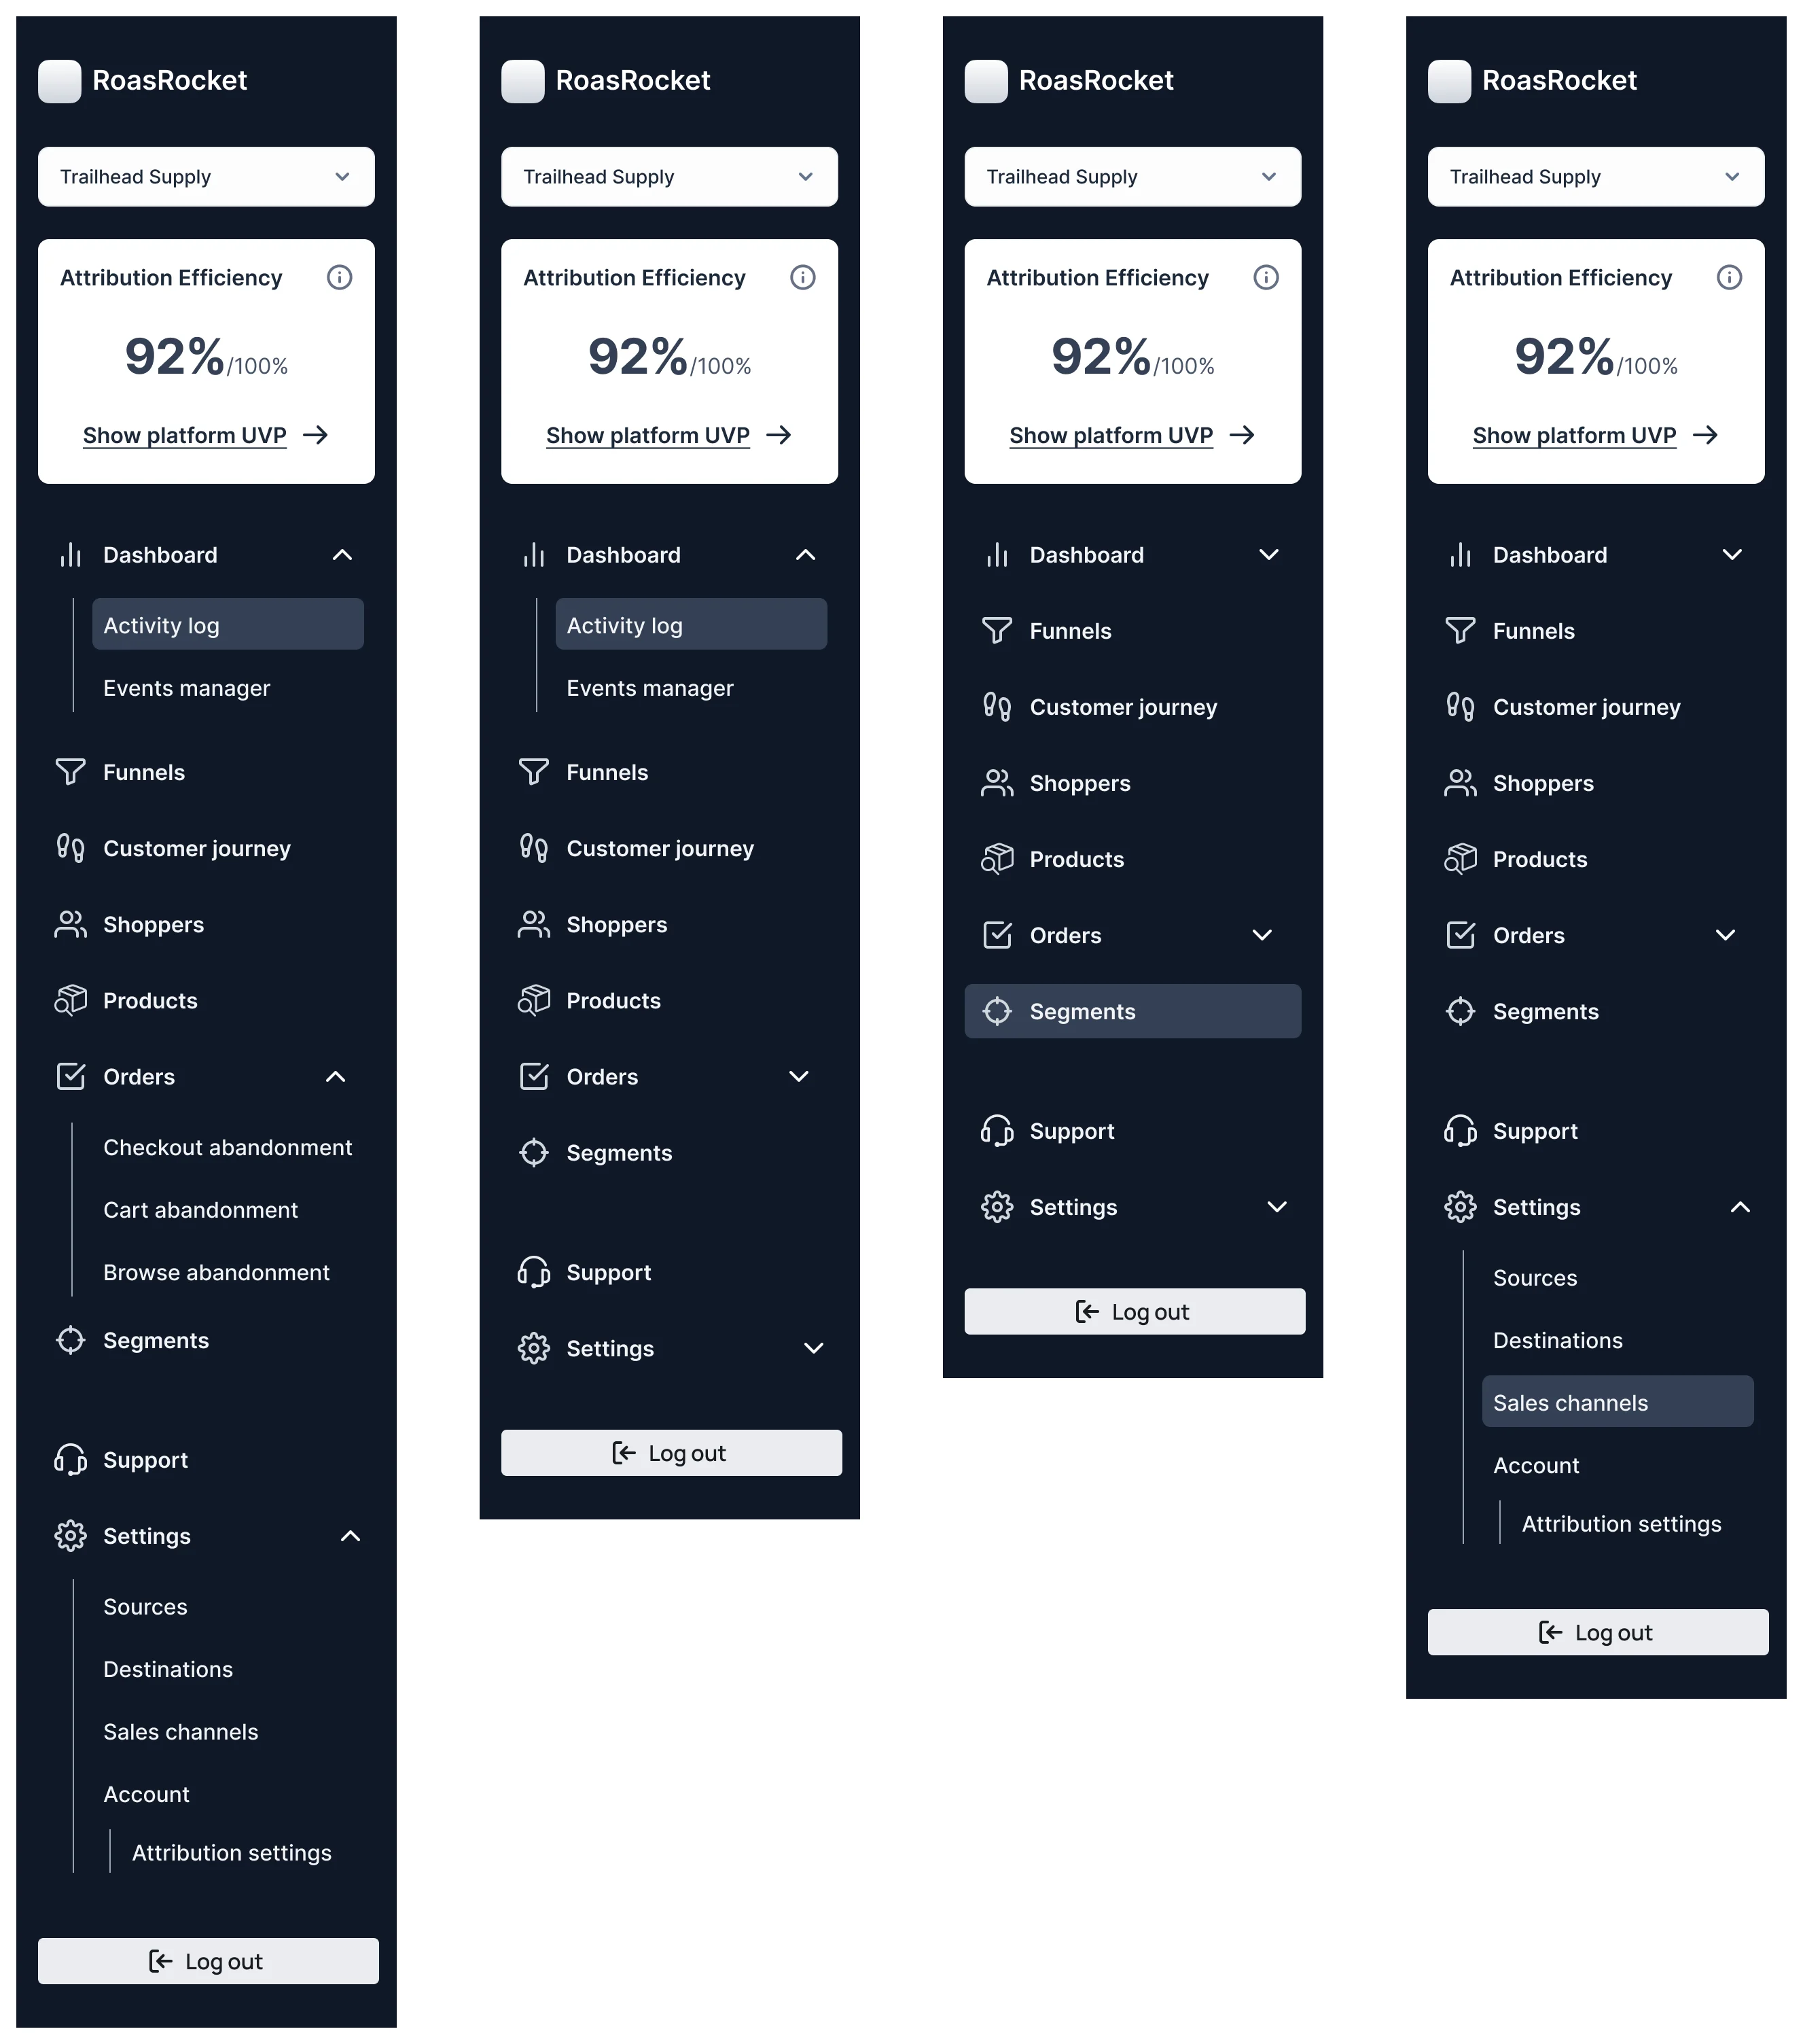
One sidebar for the whole chain
- Found
- Analysis, audiences, commerce and setup live in one product, and a flat list of every page would hide the setup a new account needs first.
- Decided
- Flows were mapped state by state before layout; the sidebar then groups the product the way the chain runs: dashboards, funnels, journeys, shoppers, products, orders and segments, with sources, destinations and sales channels under Settings.
-
Sign-up: every state before the first screen
Social sign-up or email, three kinds of wrong email, then the code.
Open the full map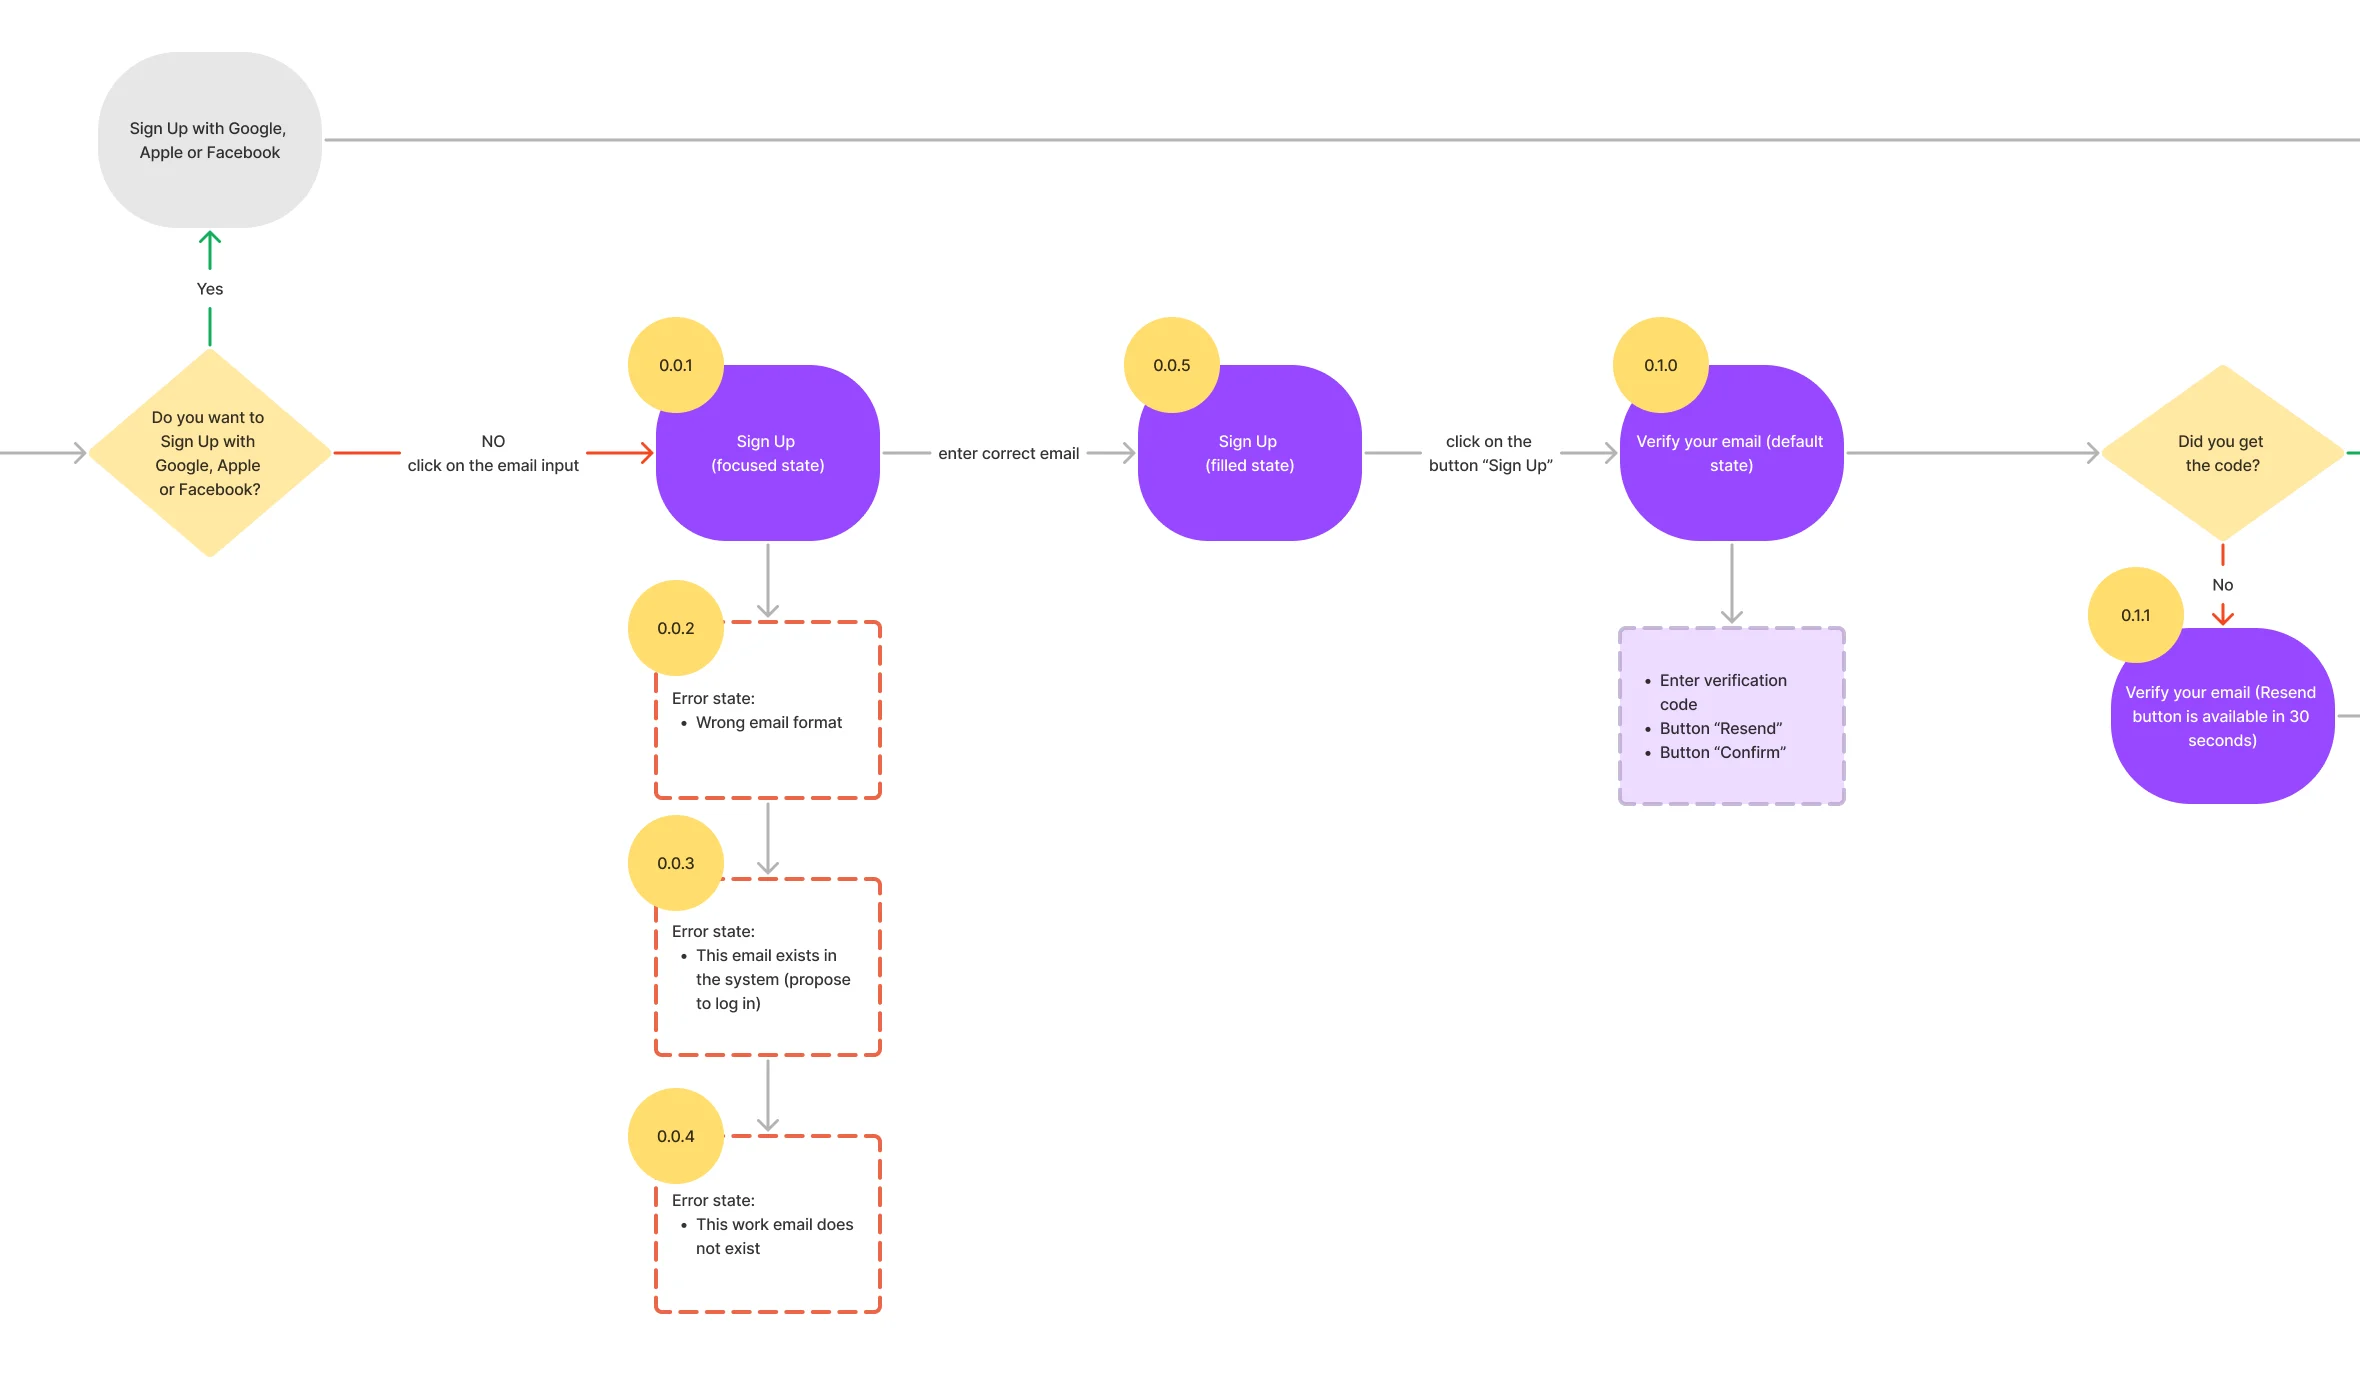
-
Onboarding: a domain added by hand
When the domain isn’t found automatically: paste it, verify it, then set up the DNS record.
Open the full map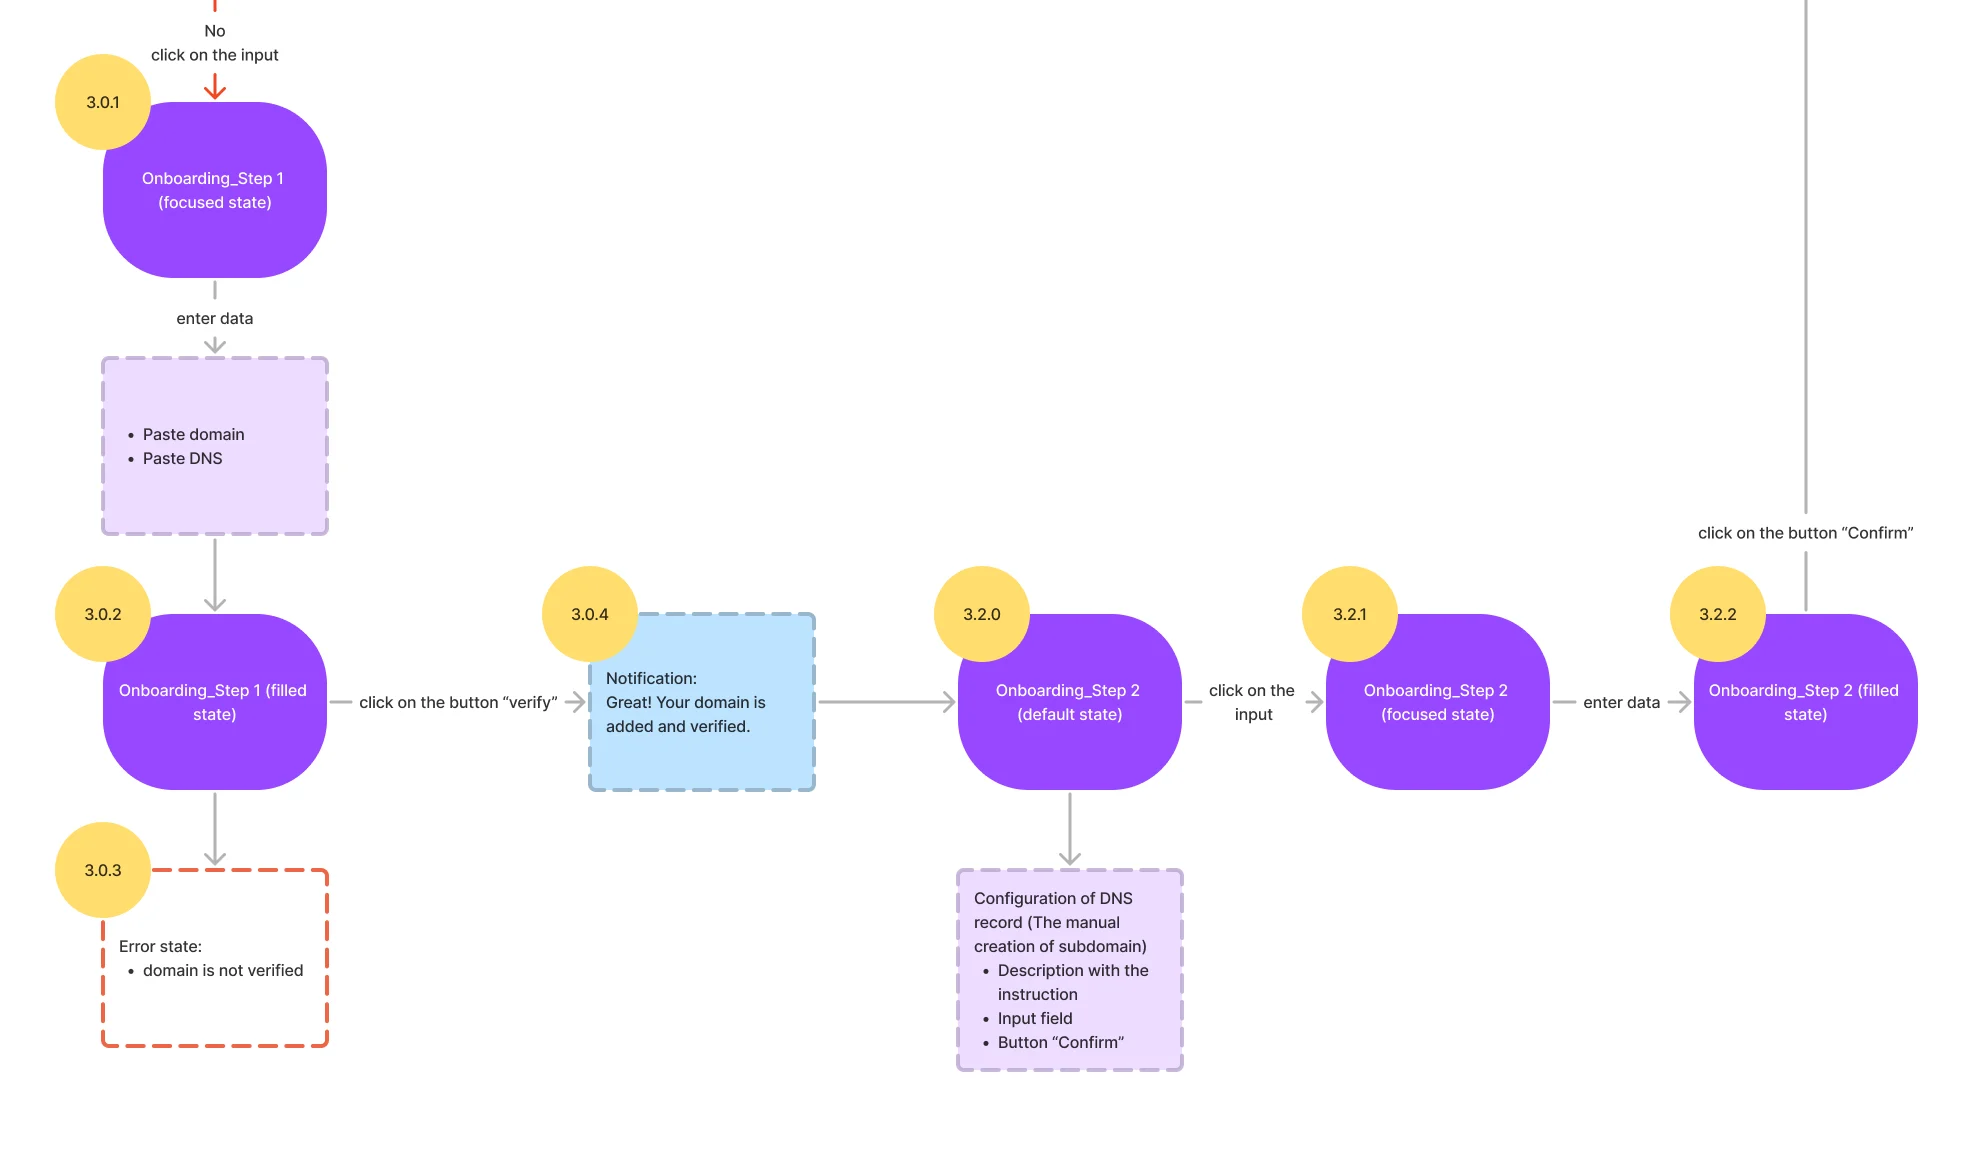
The jobs, from the first click to the invoice
Analysis first, then audiences and connections, then setup and the store. Every figure on these screens is example data.
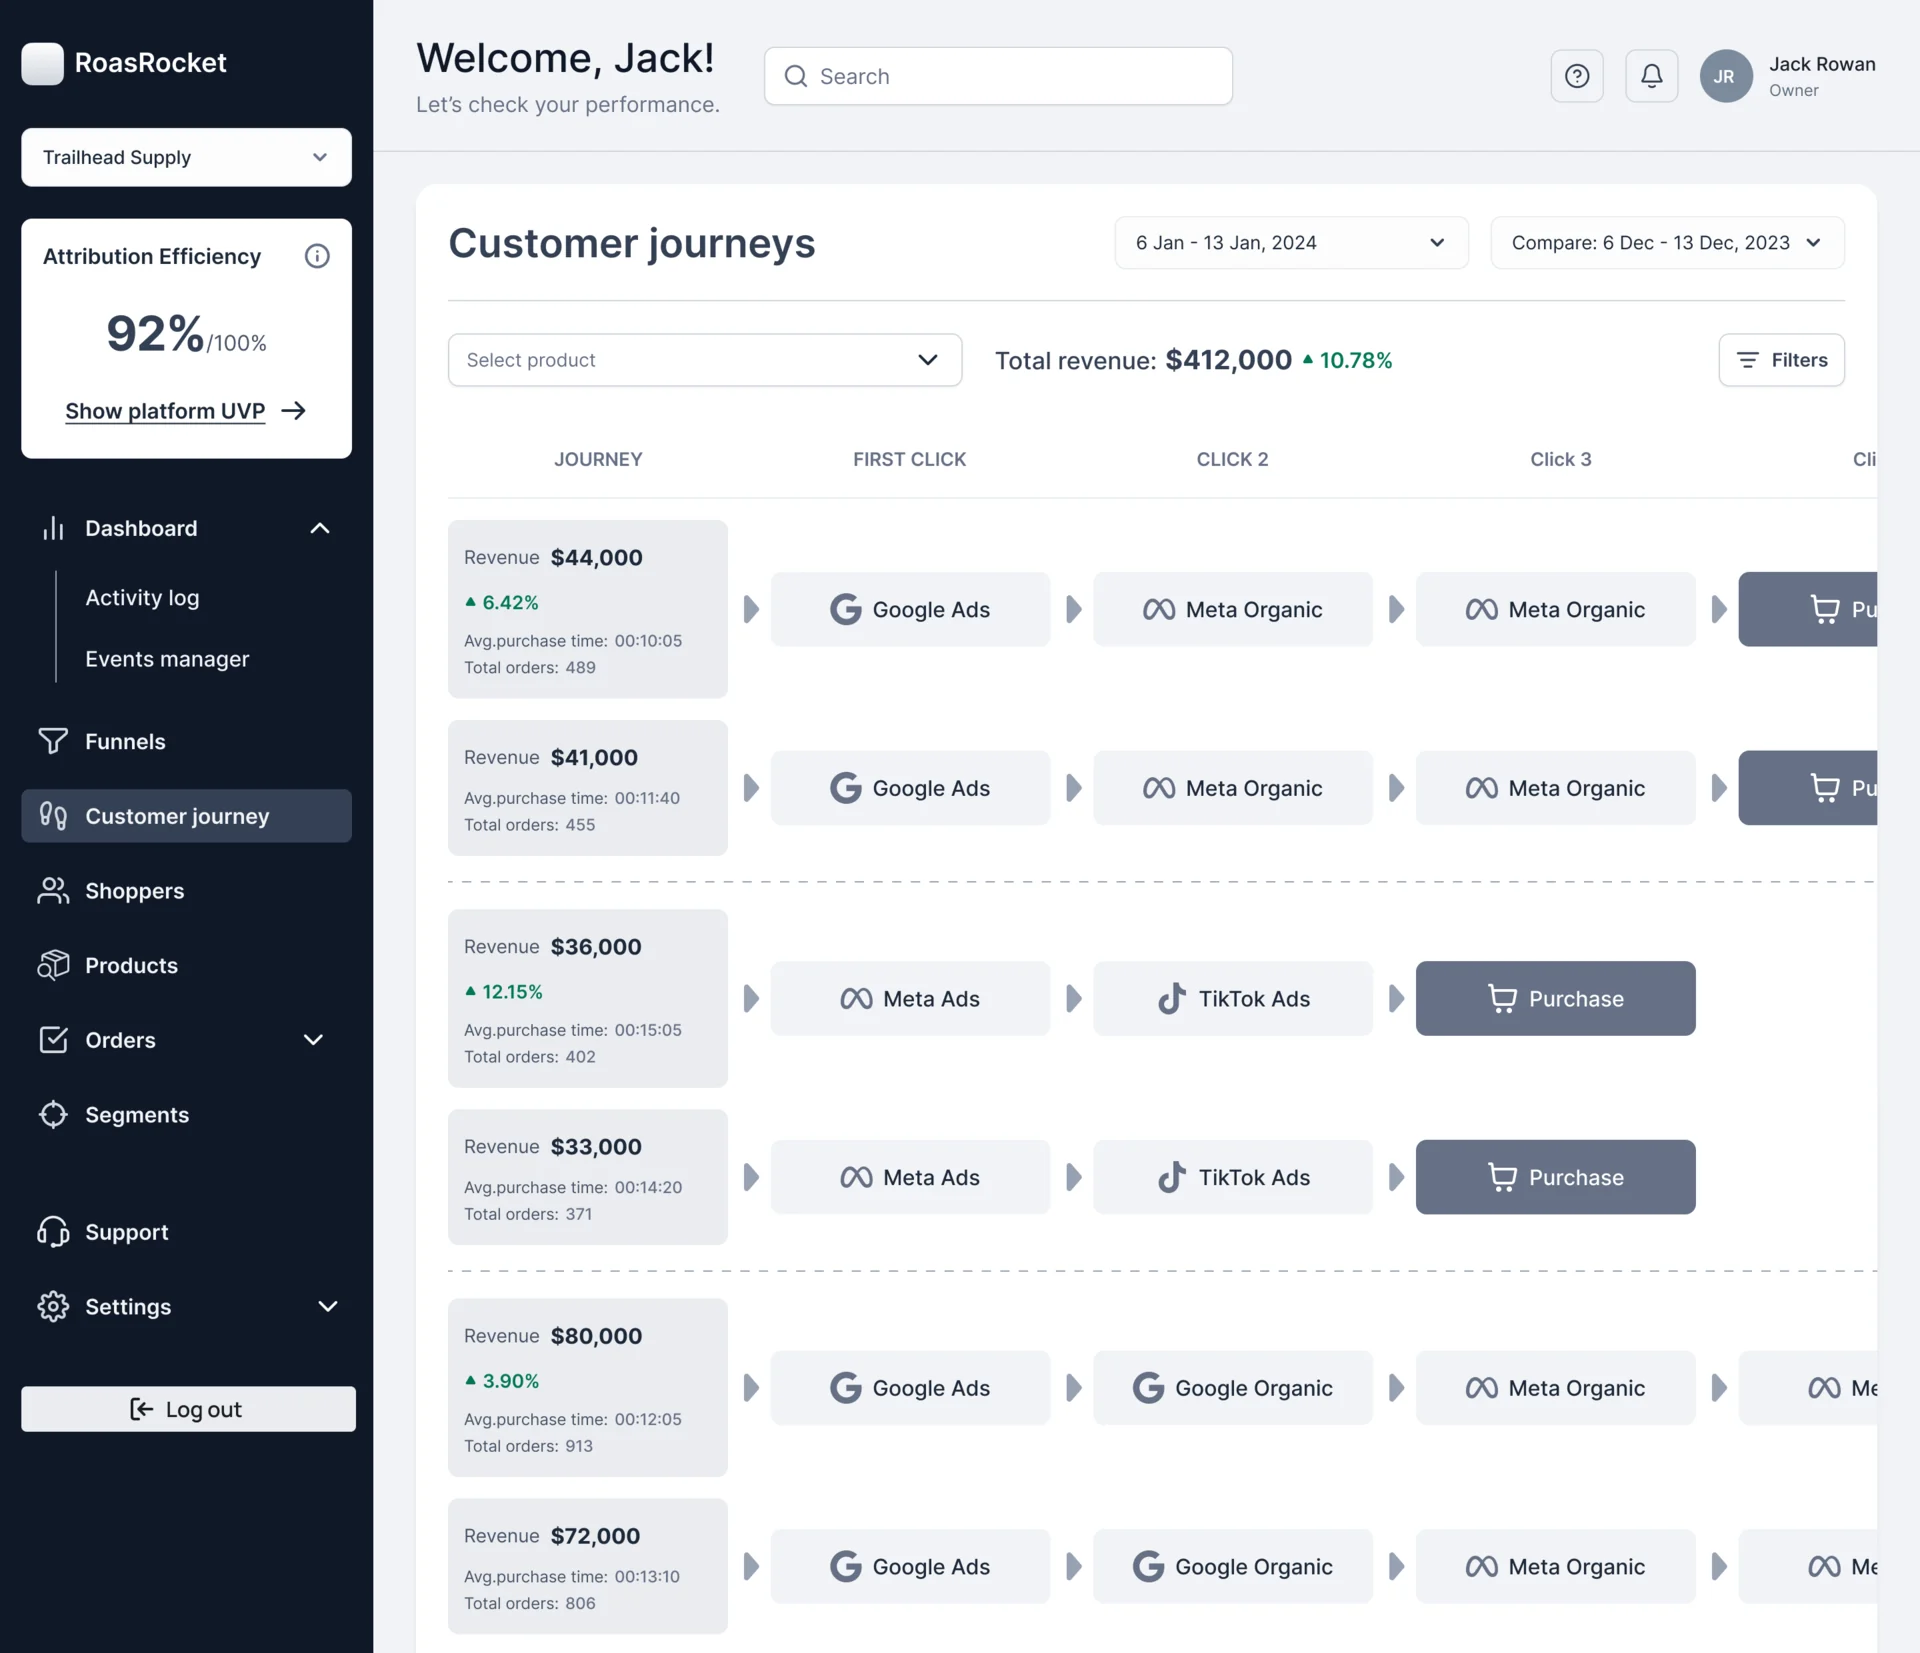
Which paths end in a purchase
- Found
- Revenue per campaign says nothing about the order in which ads and organic visits led to a sale.
- Decided
- Customer journeys as rows of clicks, from the first to the purchase, each with its revenue, time to purchase and orders, filtered by product and compared with an earlier period.
A funnel the team defines
- Found
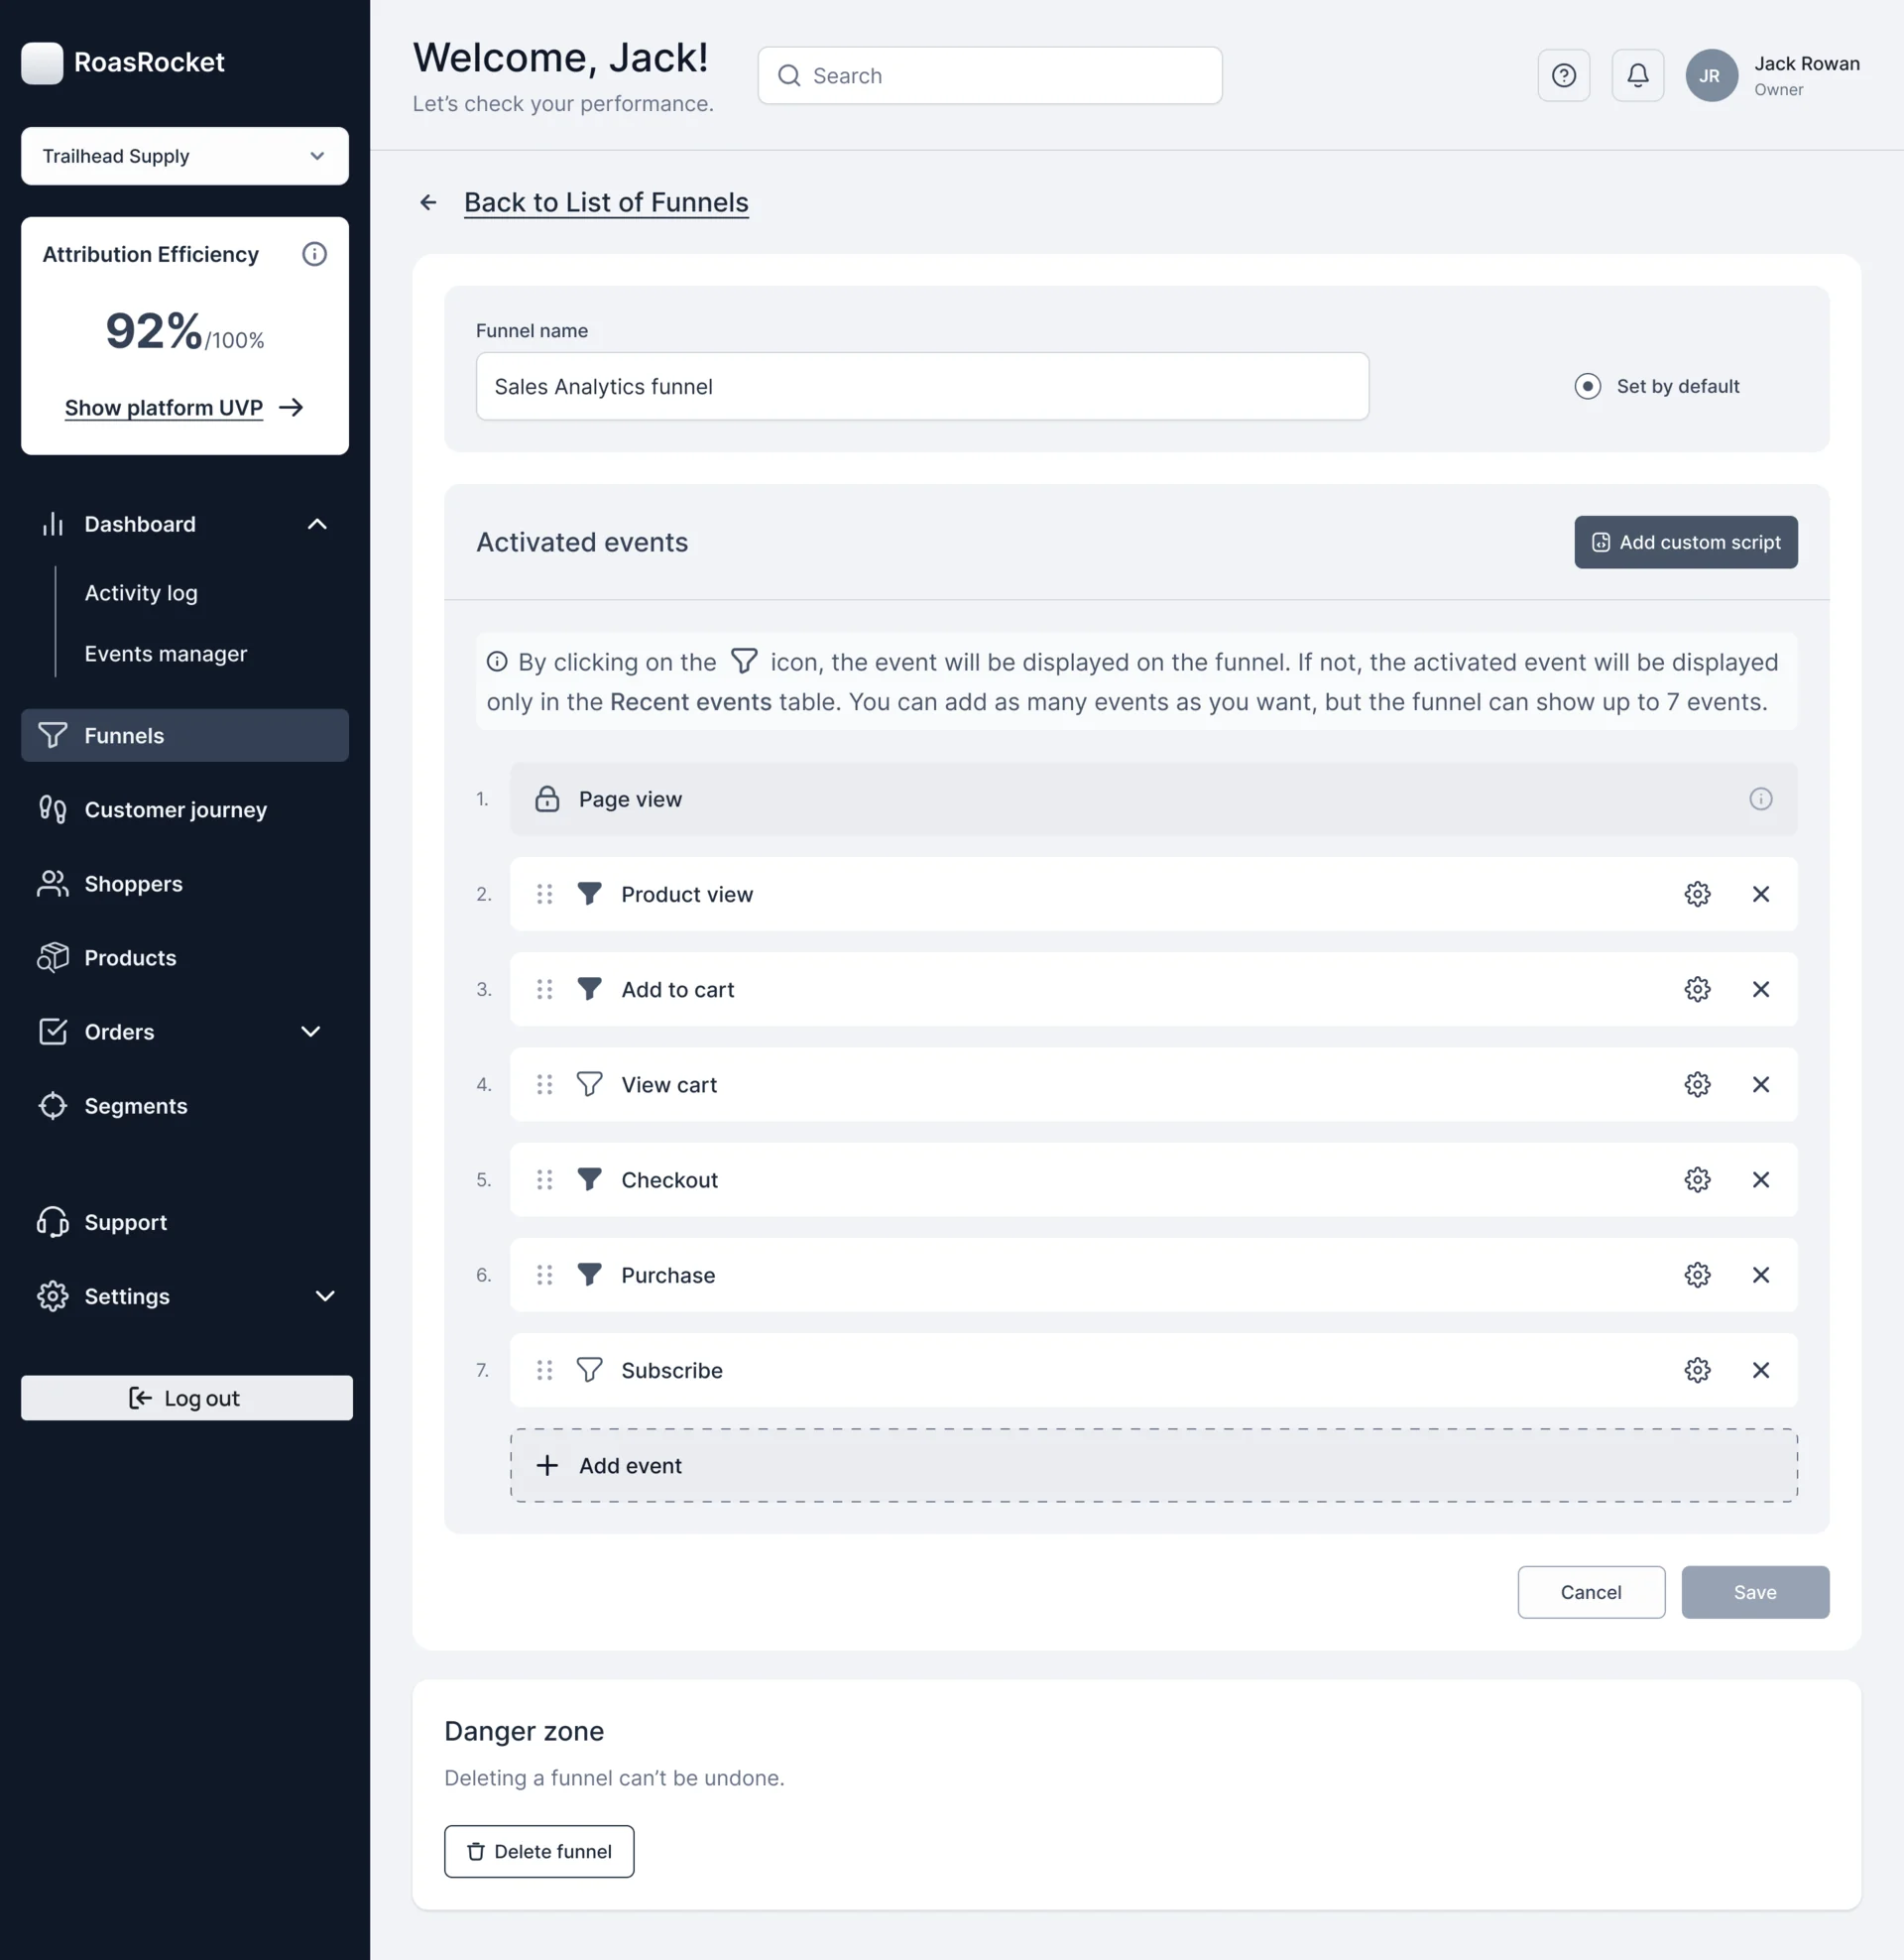
- Every store sells differently, and a fixed funnel measures steps some shops don’t have.
- Decided
- A funnel builder: activated events in order, dragged into place, each shown on the funnel or kept for the events table, up to seven steps, one funnel set as the default.
Audiences built from behaviour
- Found
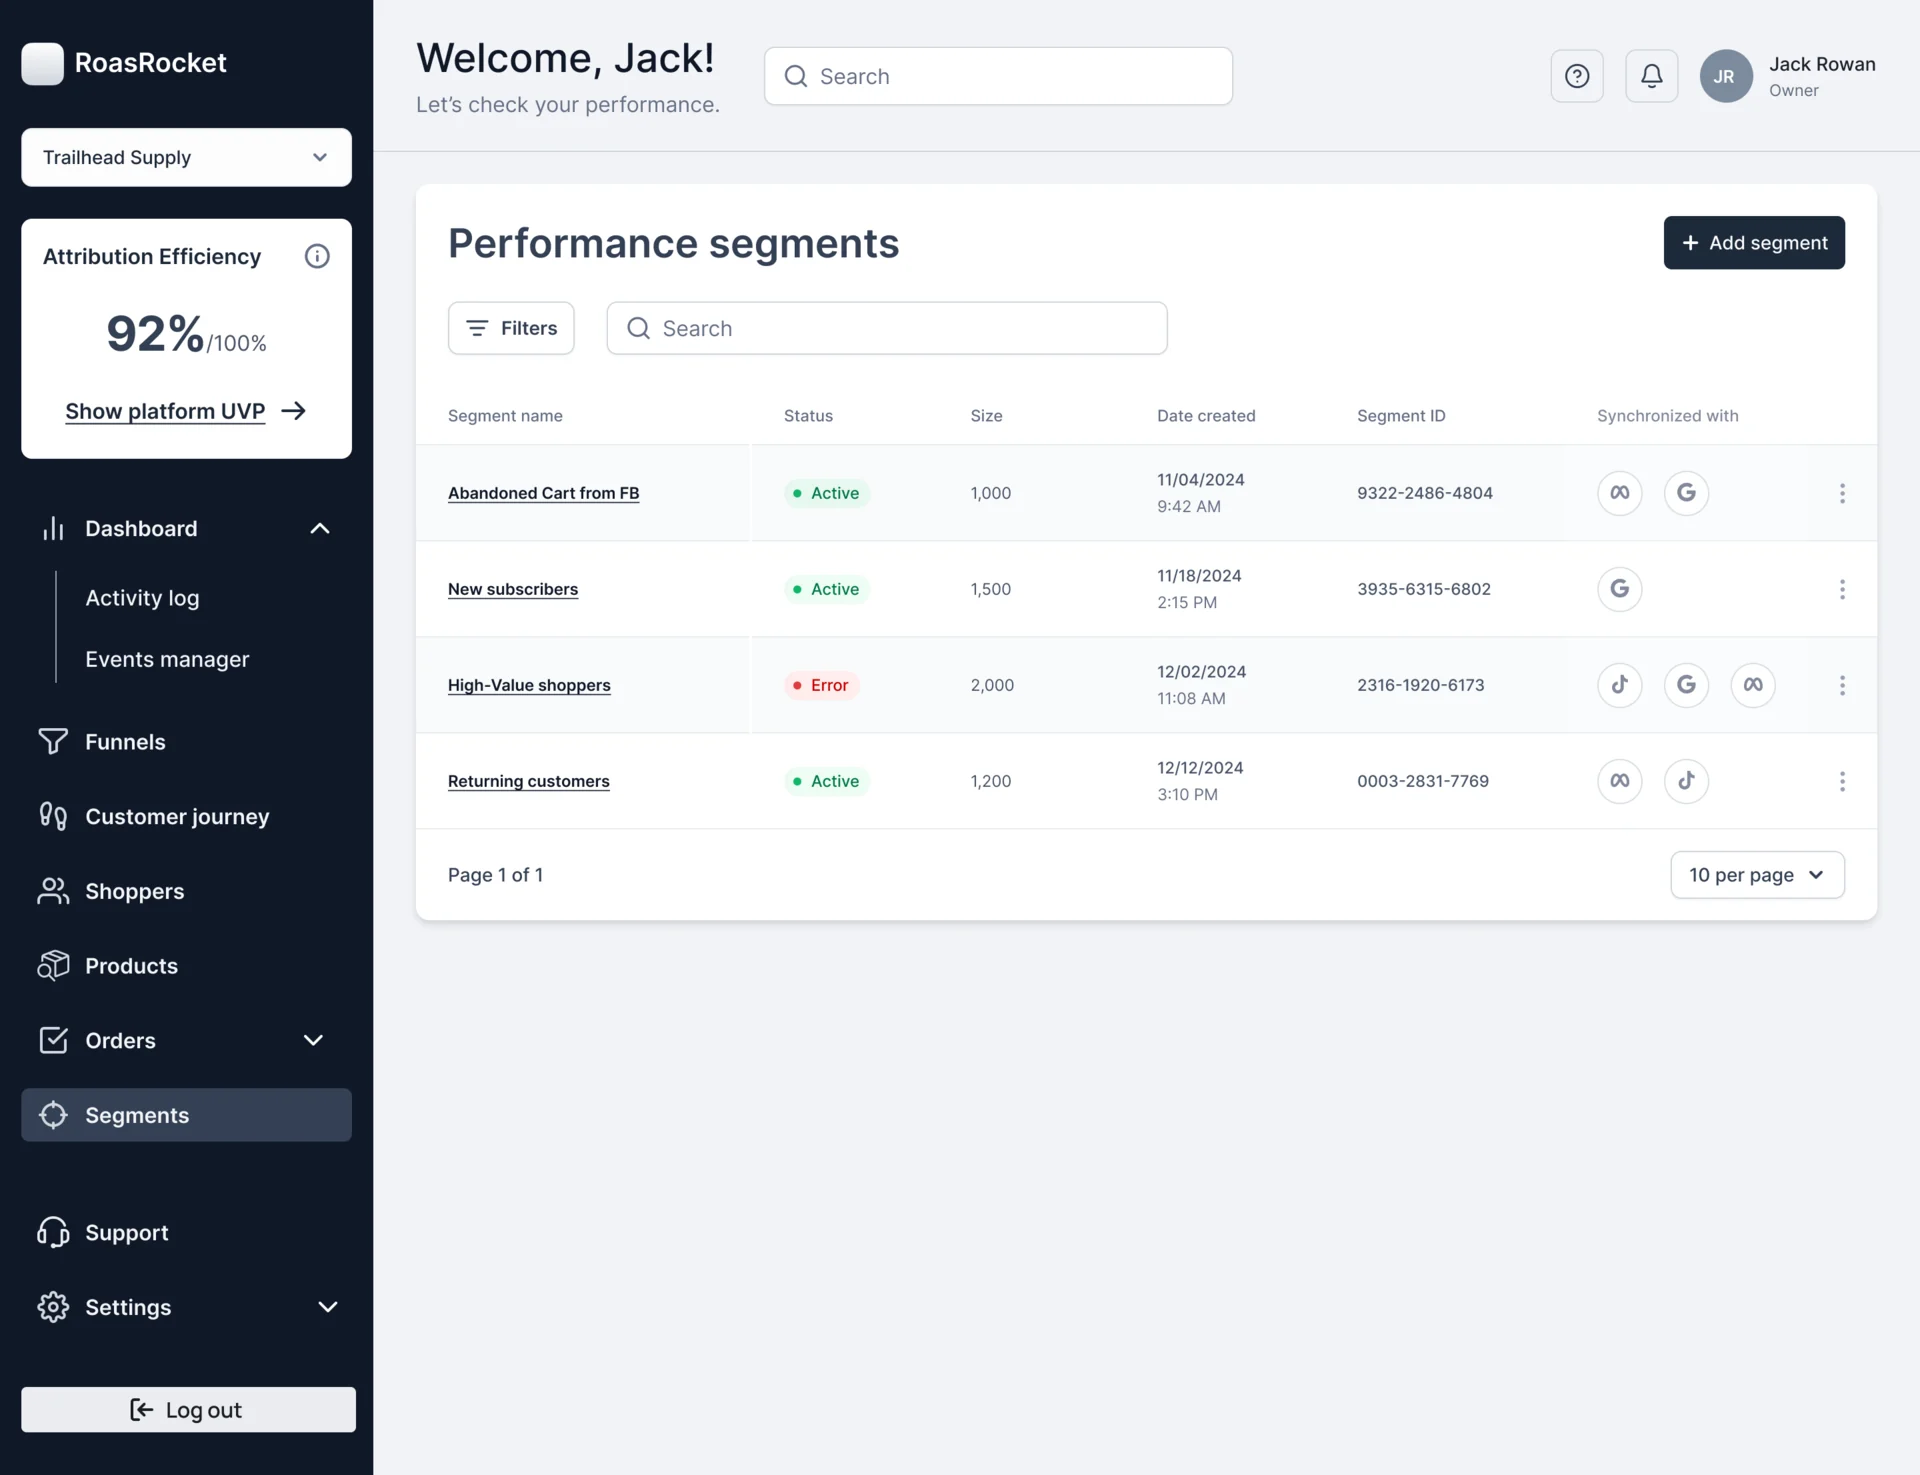
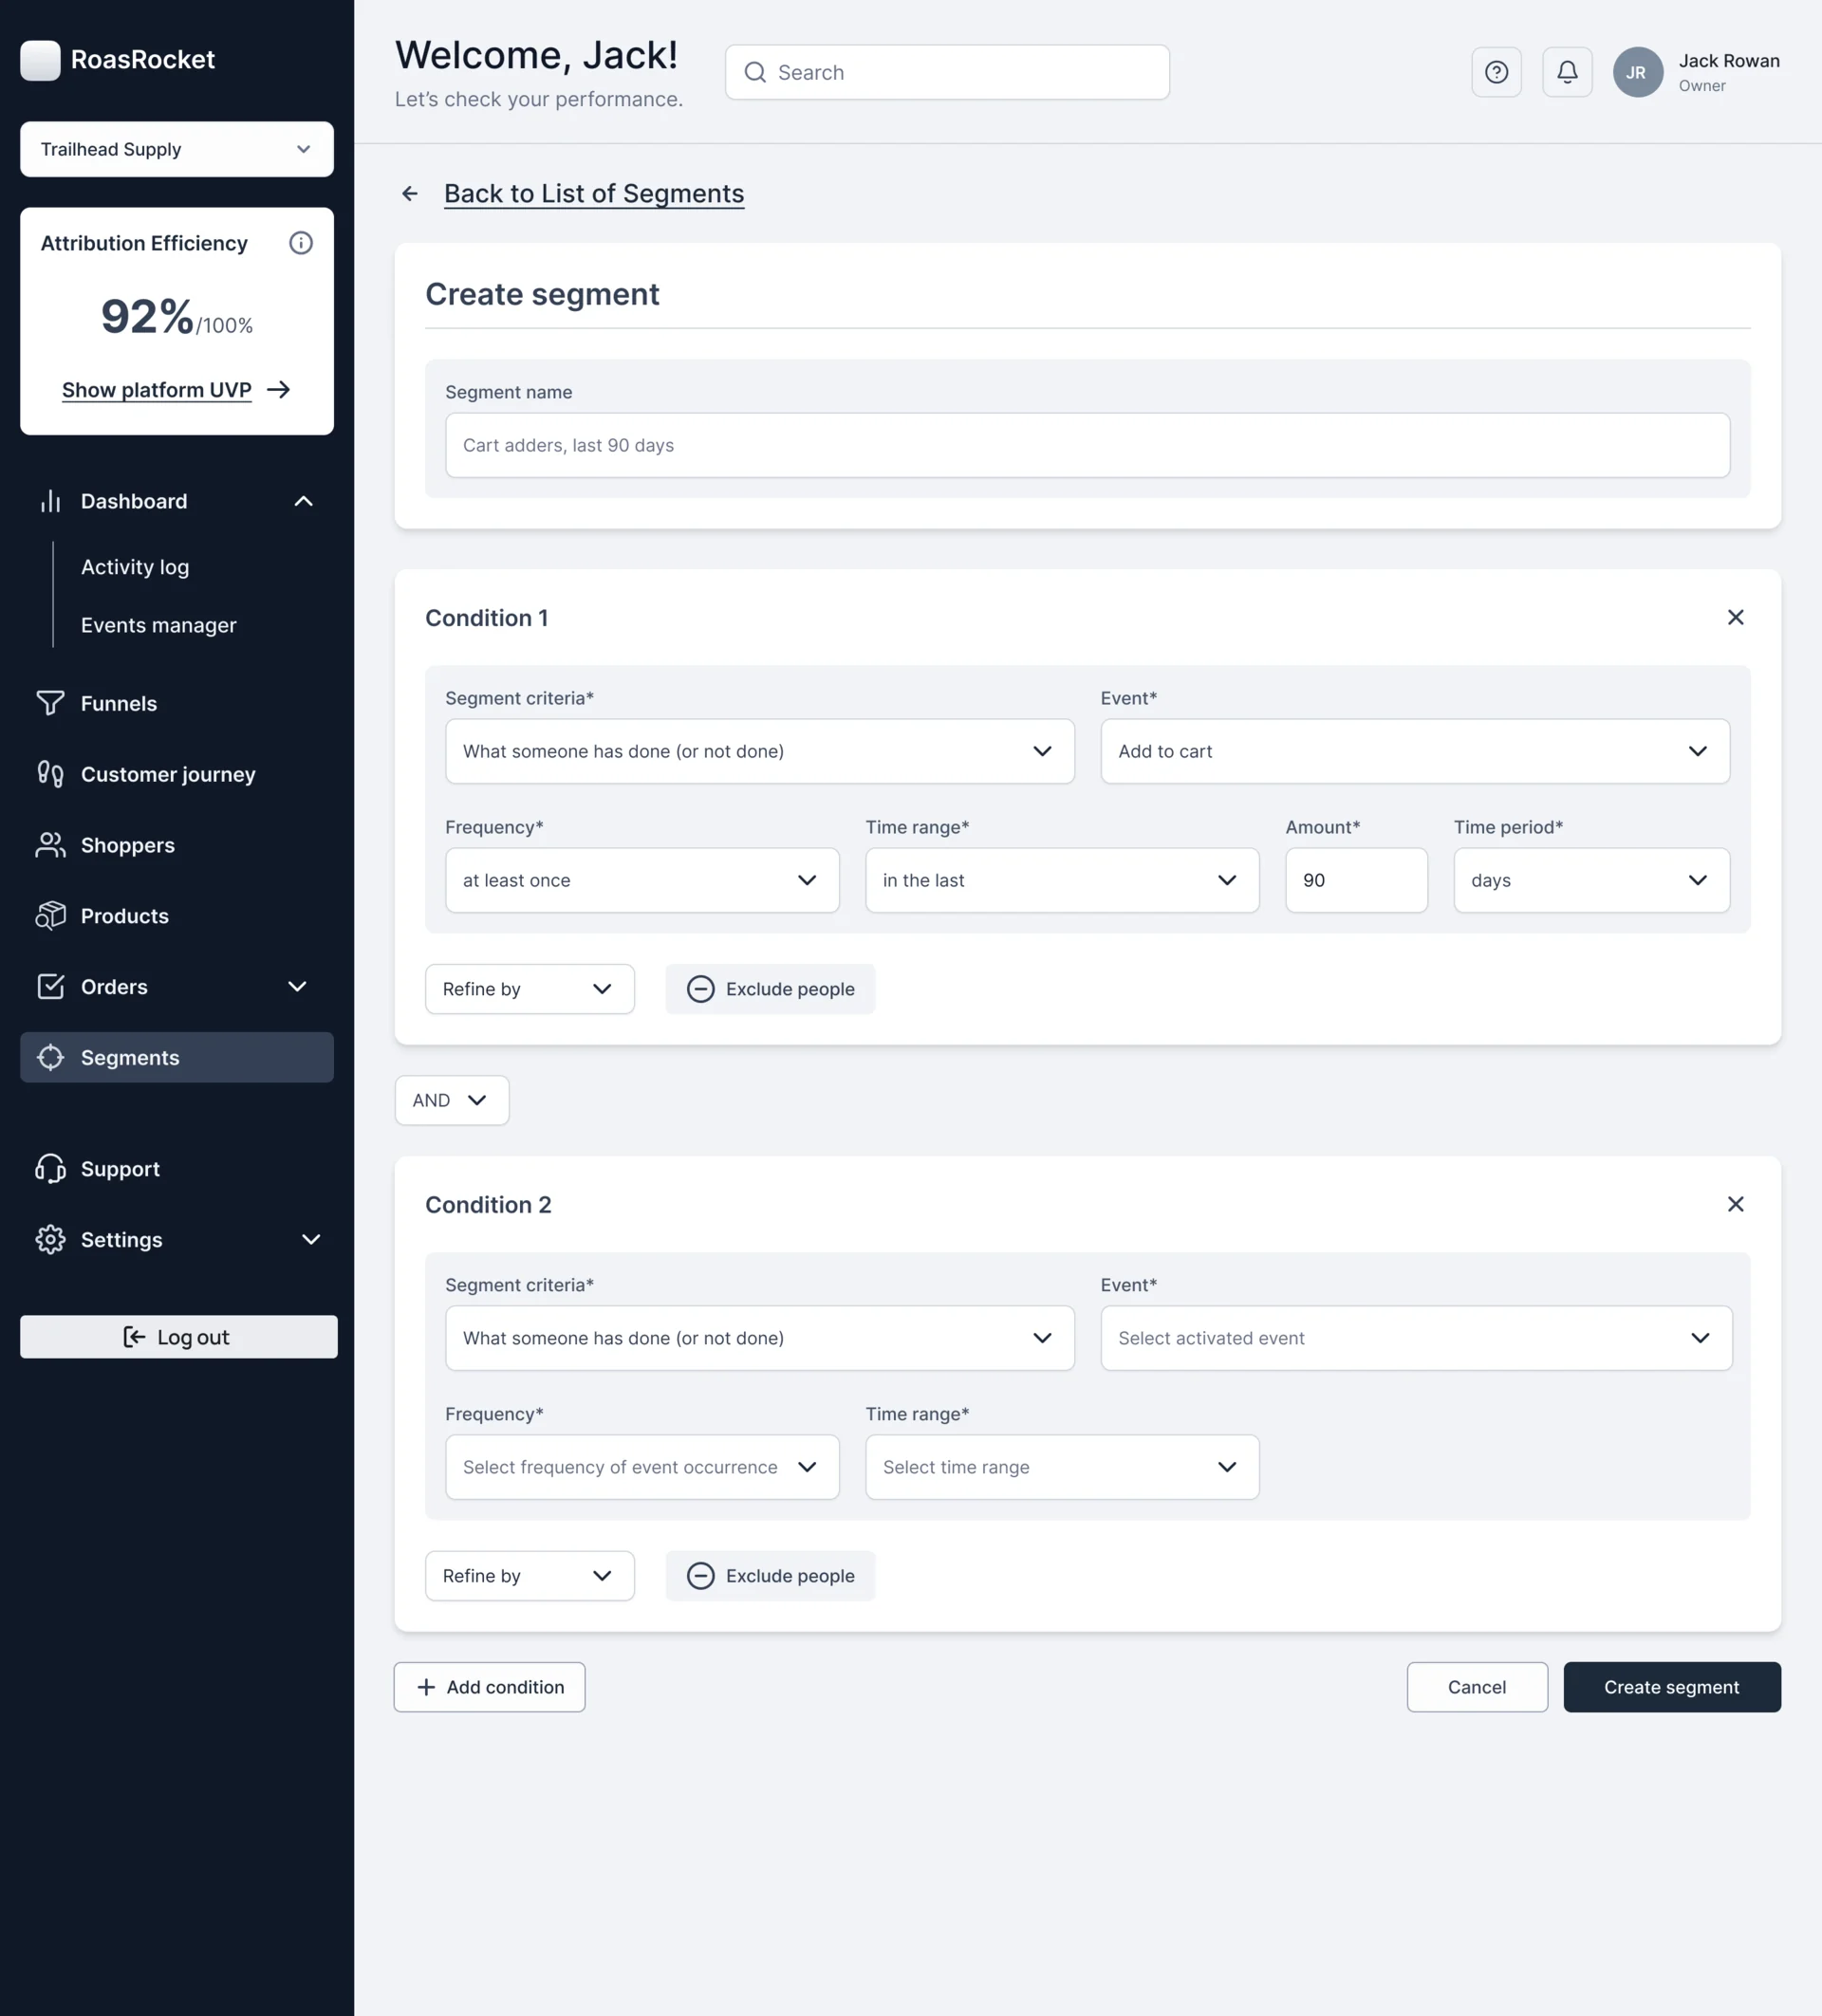
- An audience worth sending to an ad platform is defined by what people did, how often and when, not by a list someone exported.
- Decided
- Segments built from conditions: what someone has done or not done, which event, how often and in what time range, joined with AND or OR; the list shows each segment’s status, size and the platforms it syncs with.
Events, and how complete they are
- Found
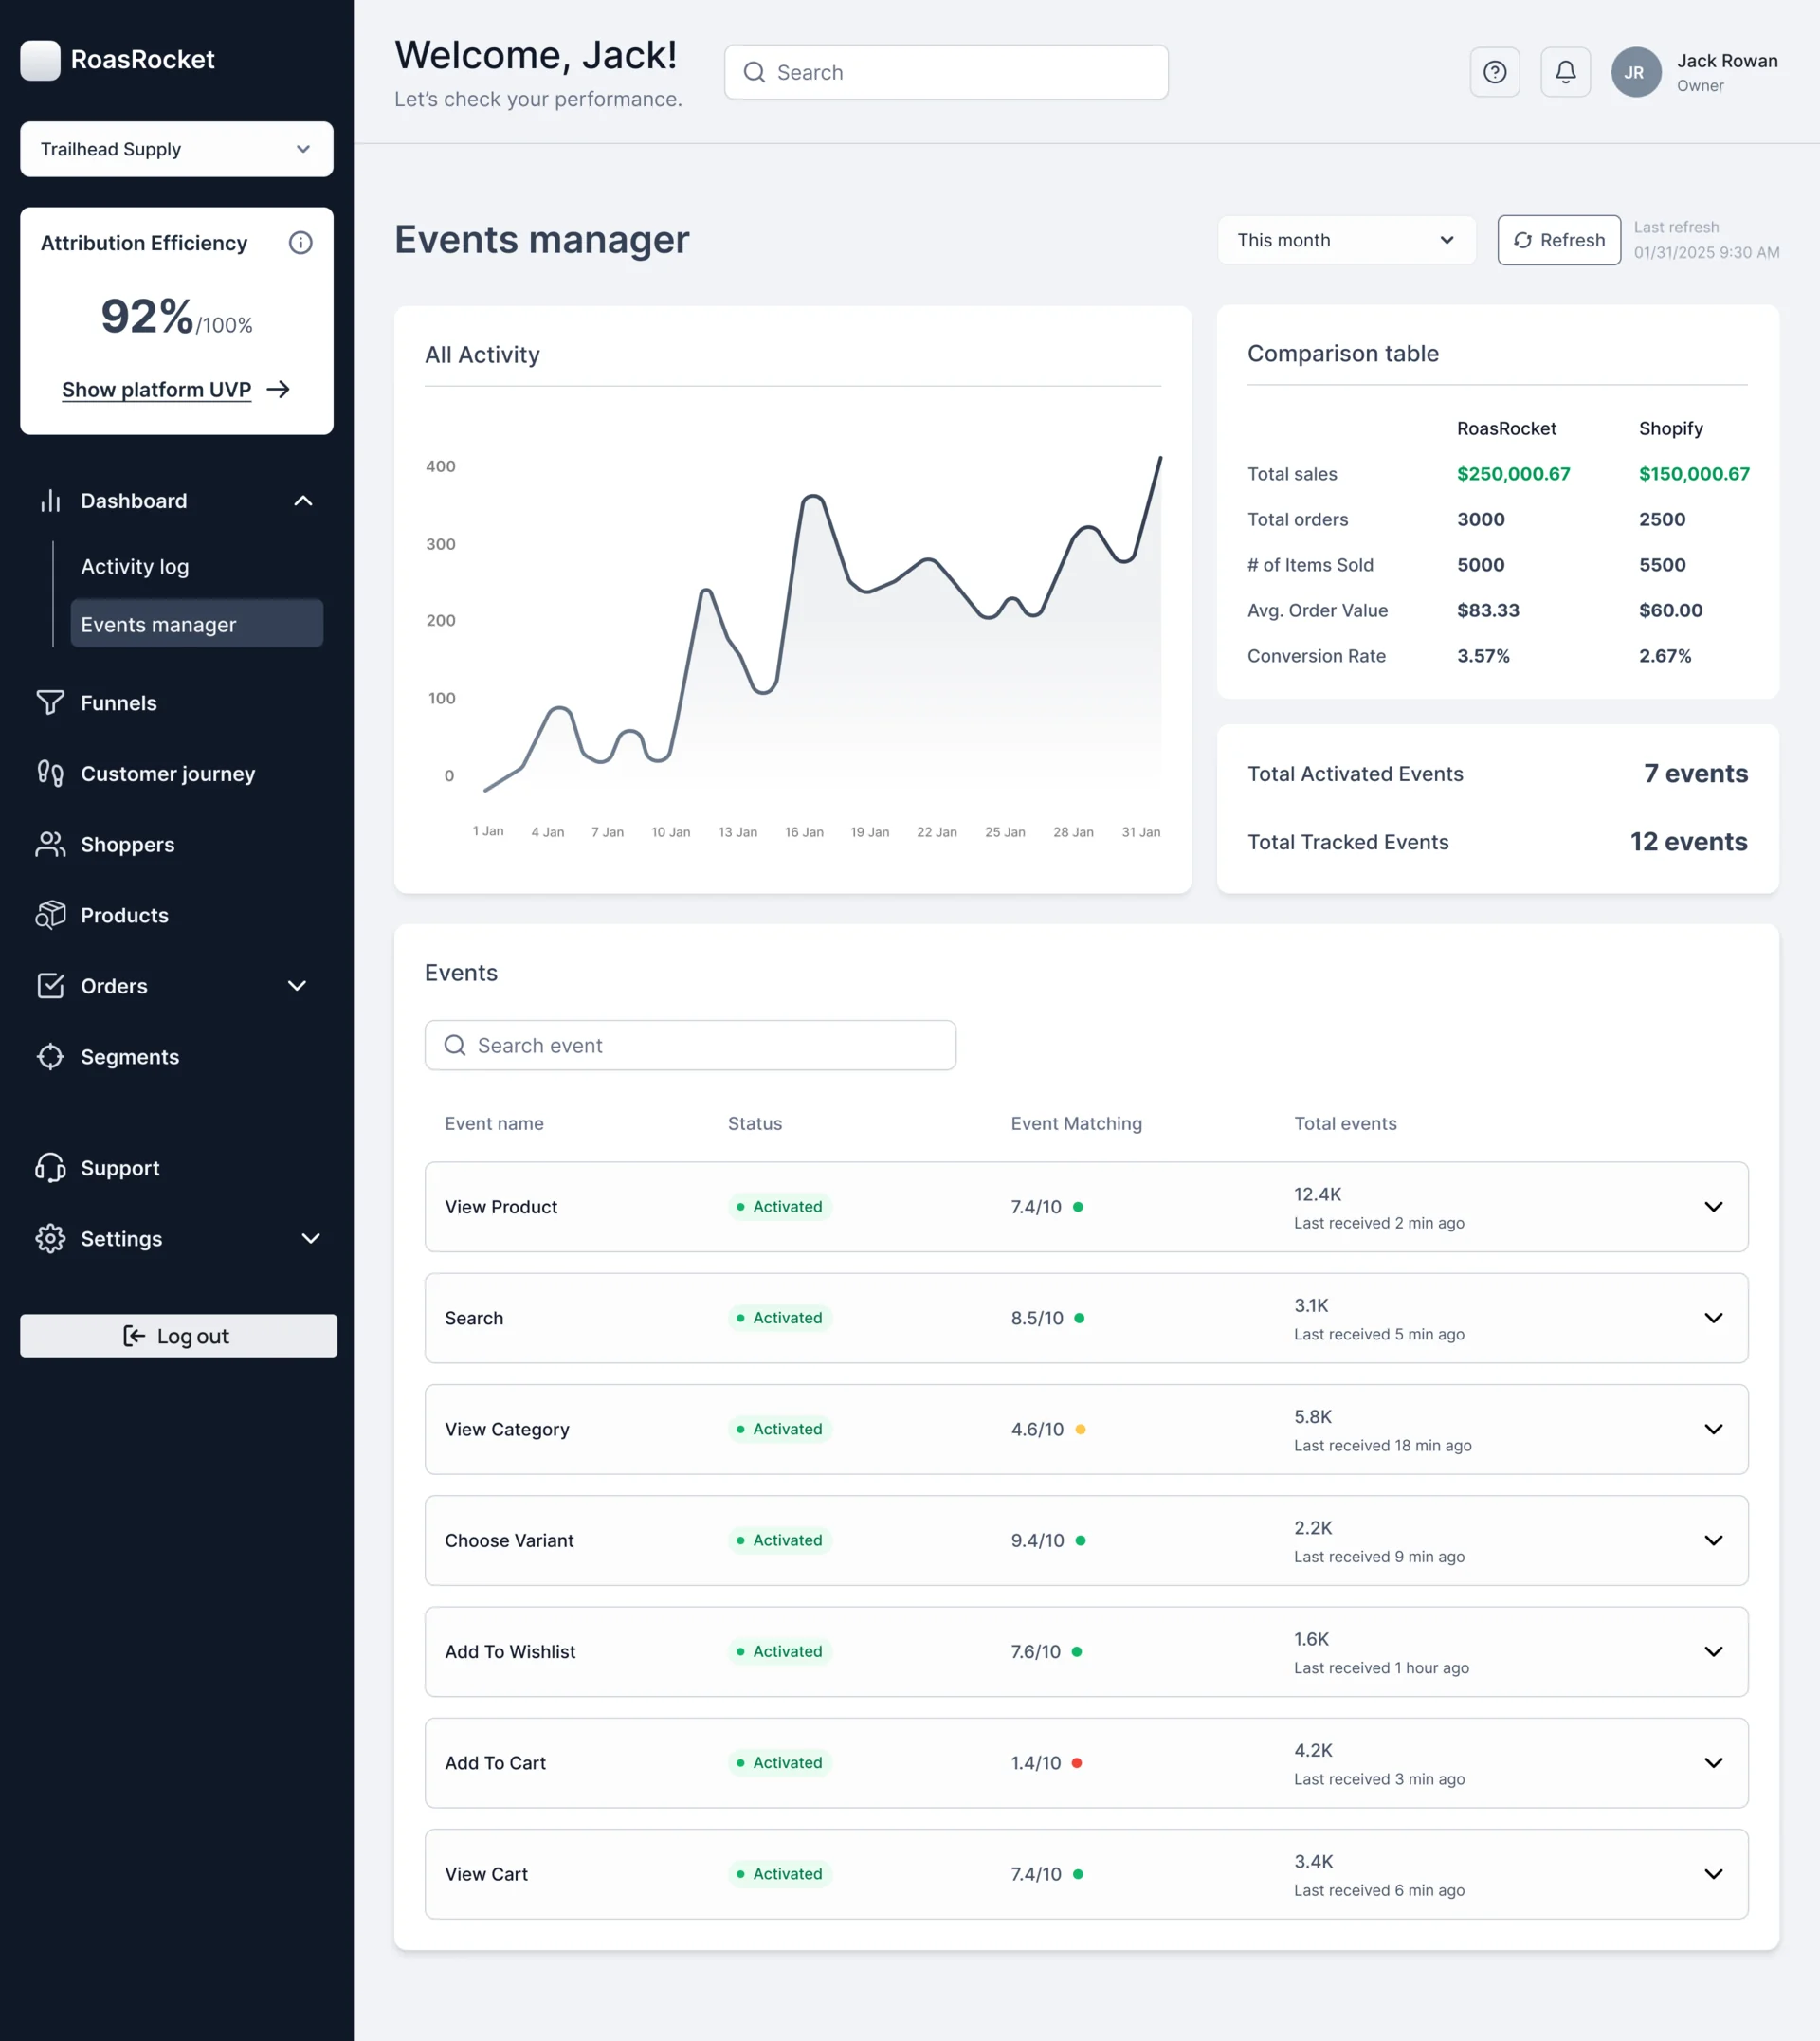
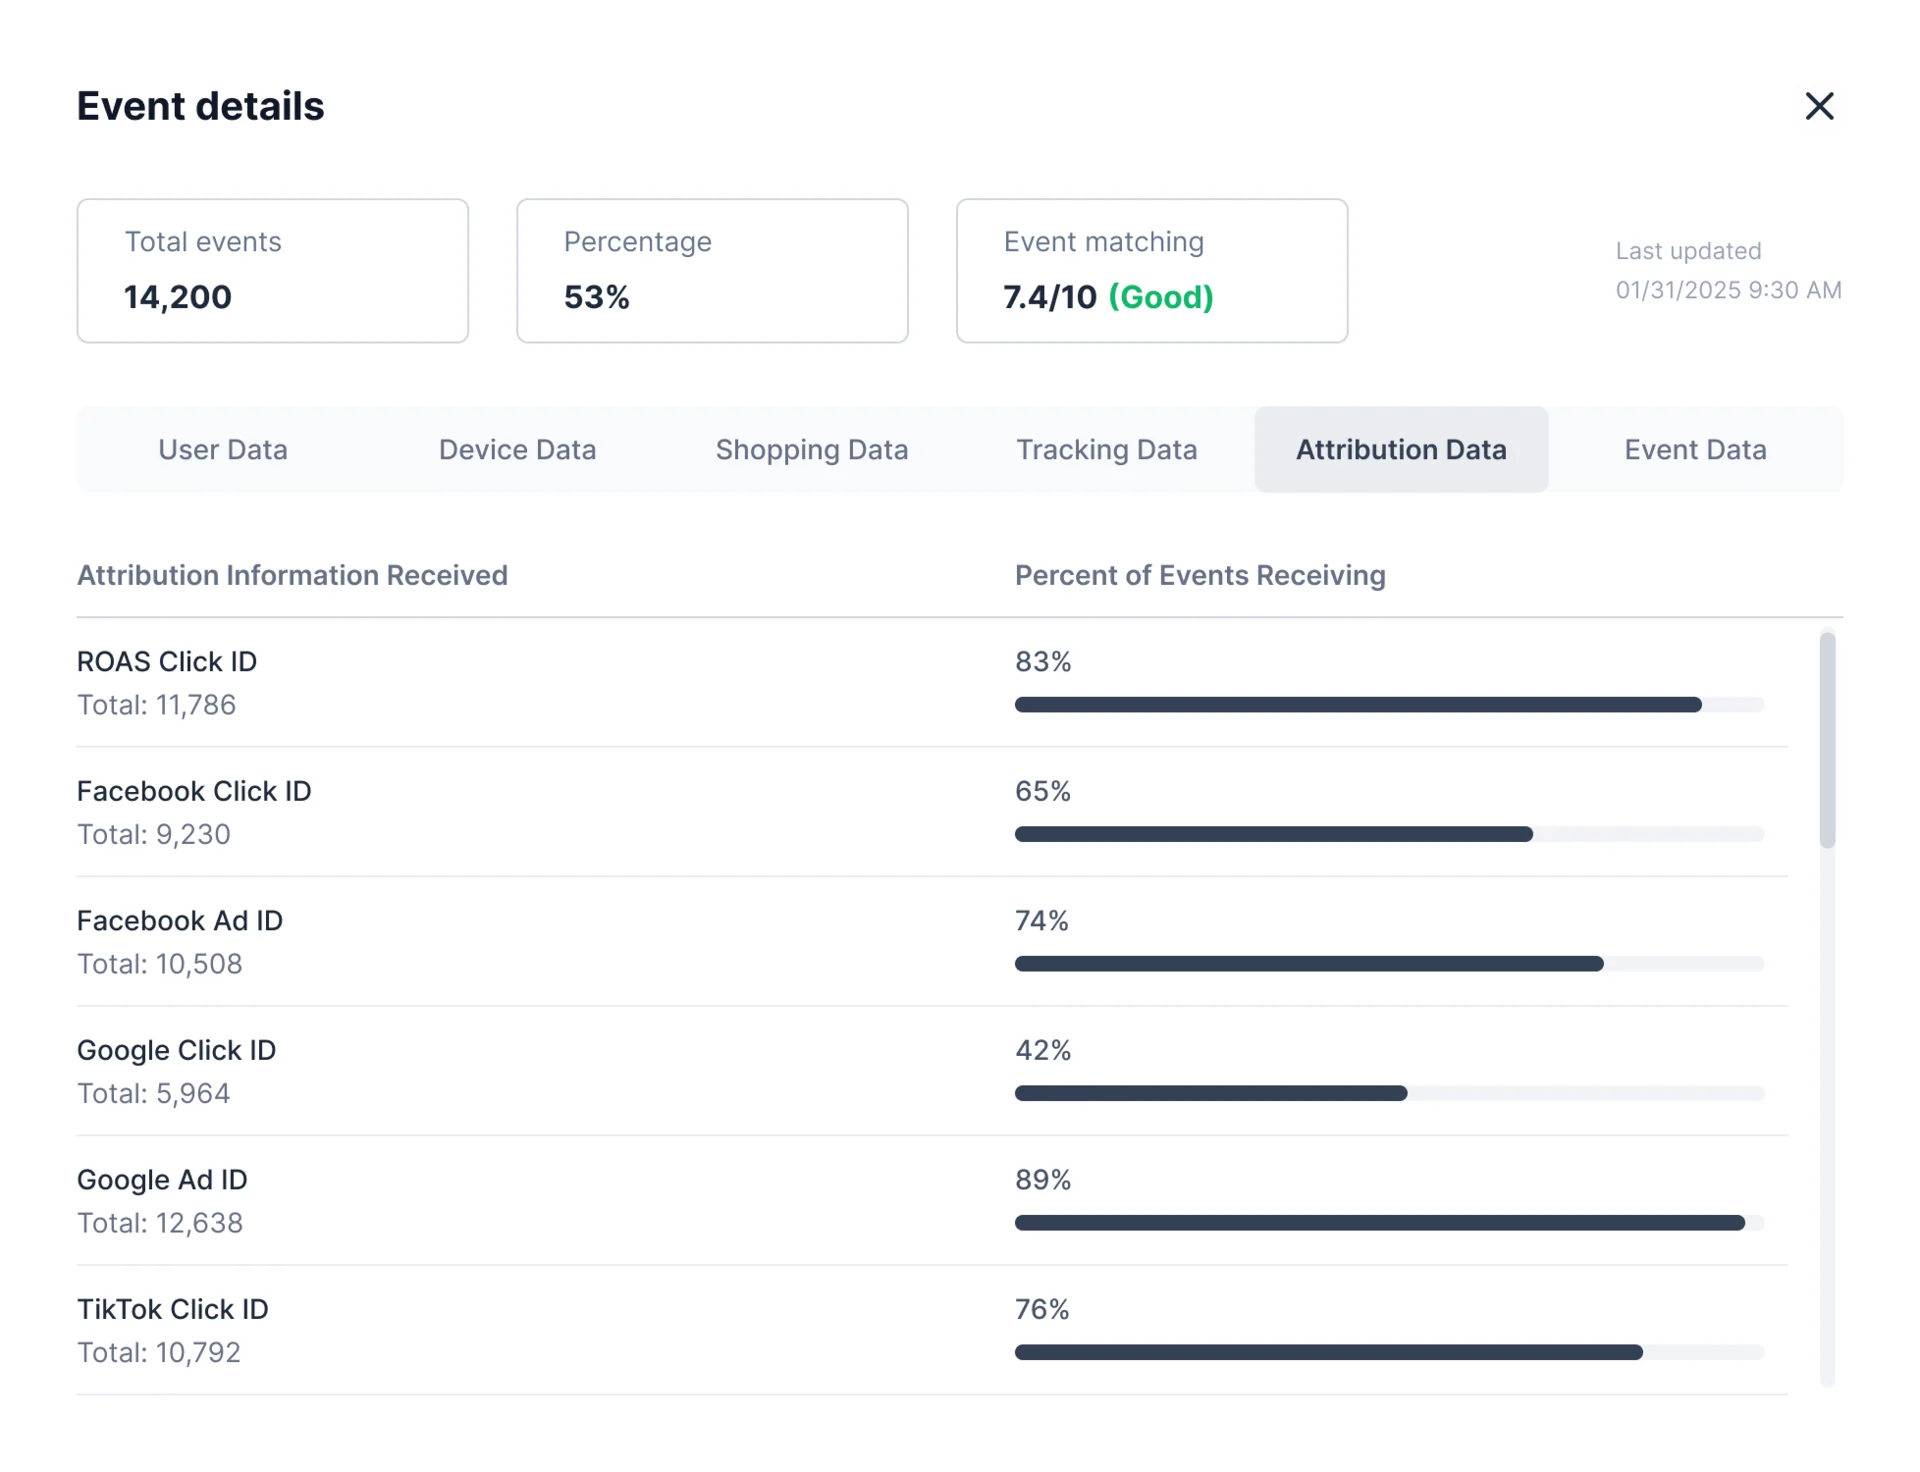
- Attribution is only as good as the data each event carries, and a missing click ID is invisible in a total.
- Decided
- An events manager with each event’s status, matching score and volume, a comparison with the store’s own figures, and per event the share of hits that carry each attribution ID.
Data sent back to the ad platforms
- Found
- Ad platforms optimise on the events they receive, and each wants a different set sent from the server or the browser.
- Decided
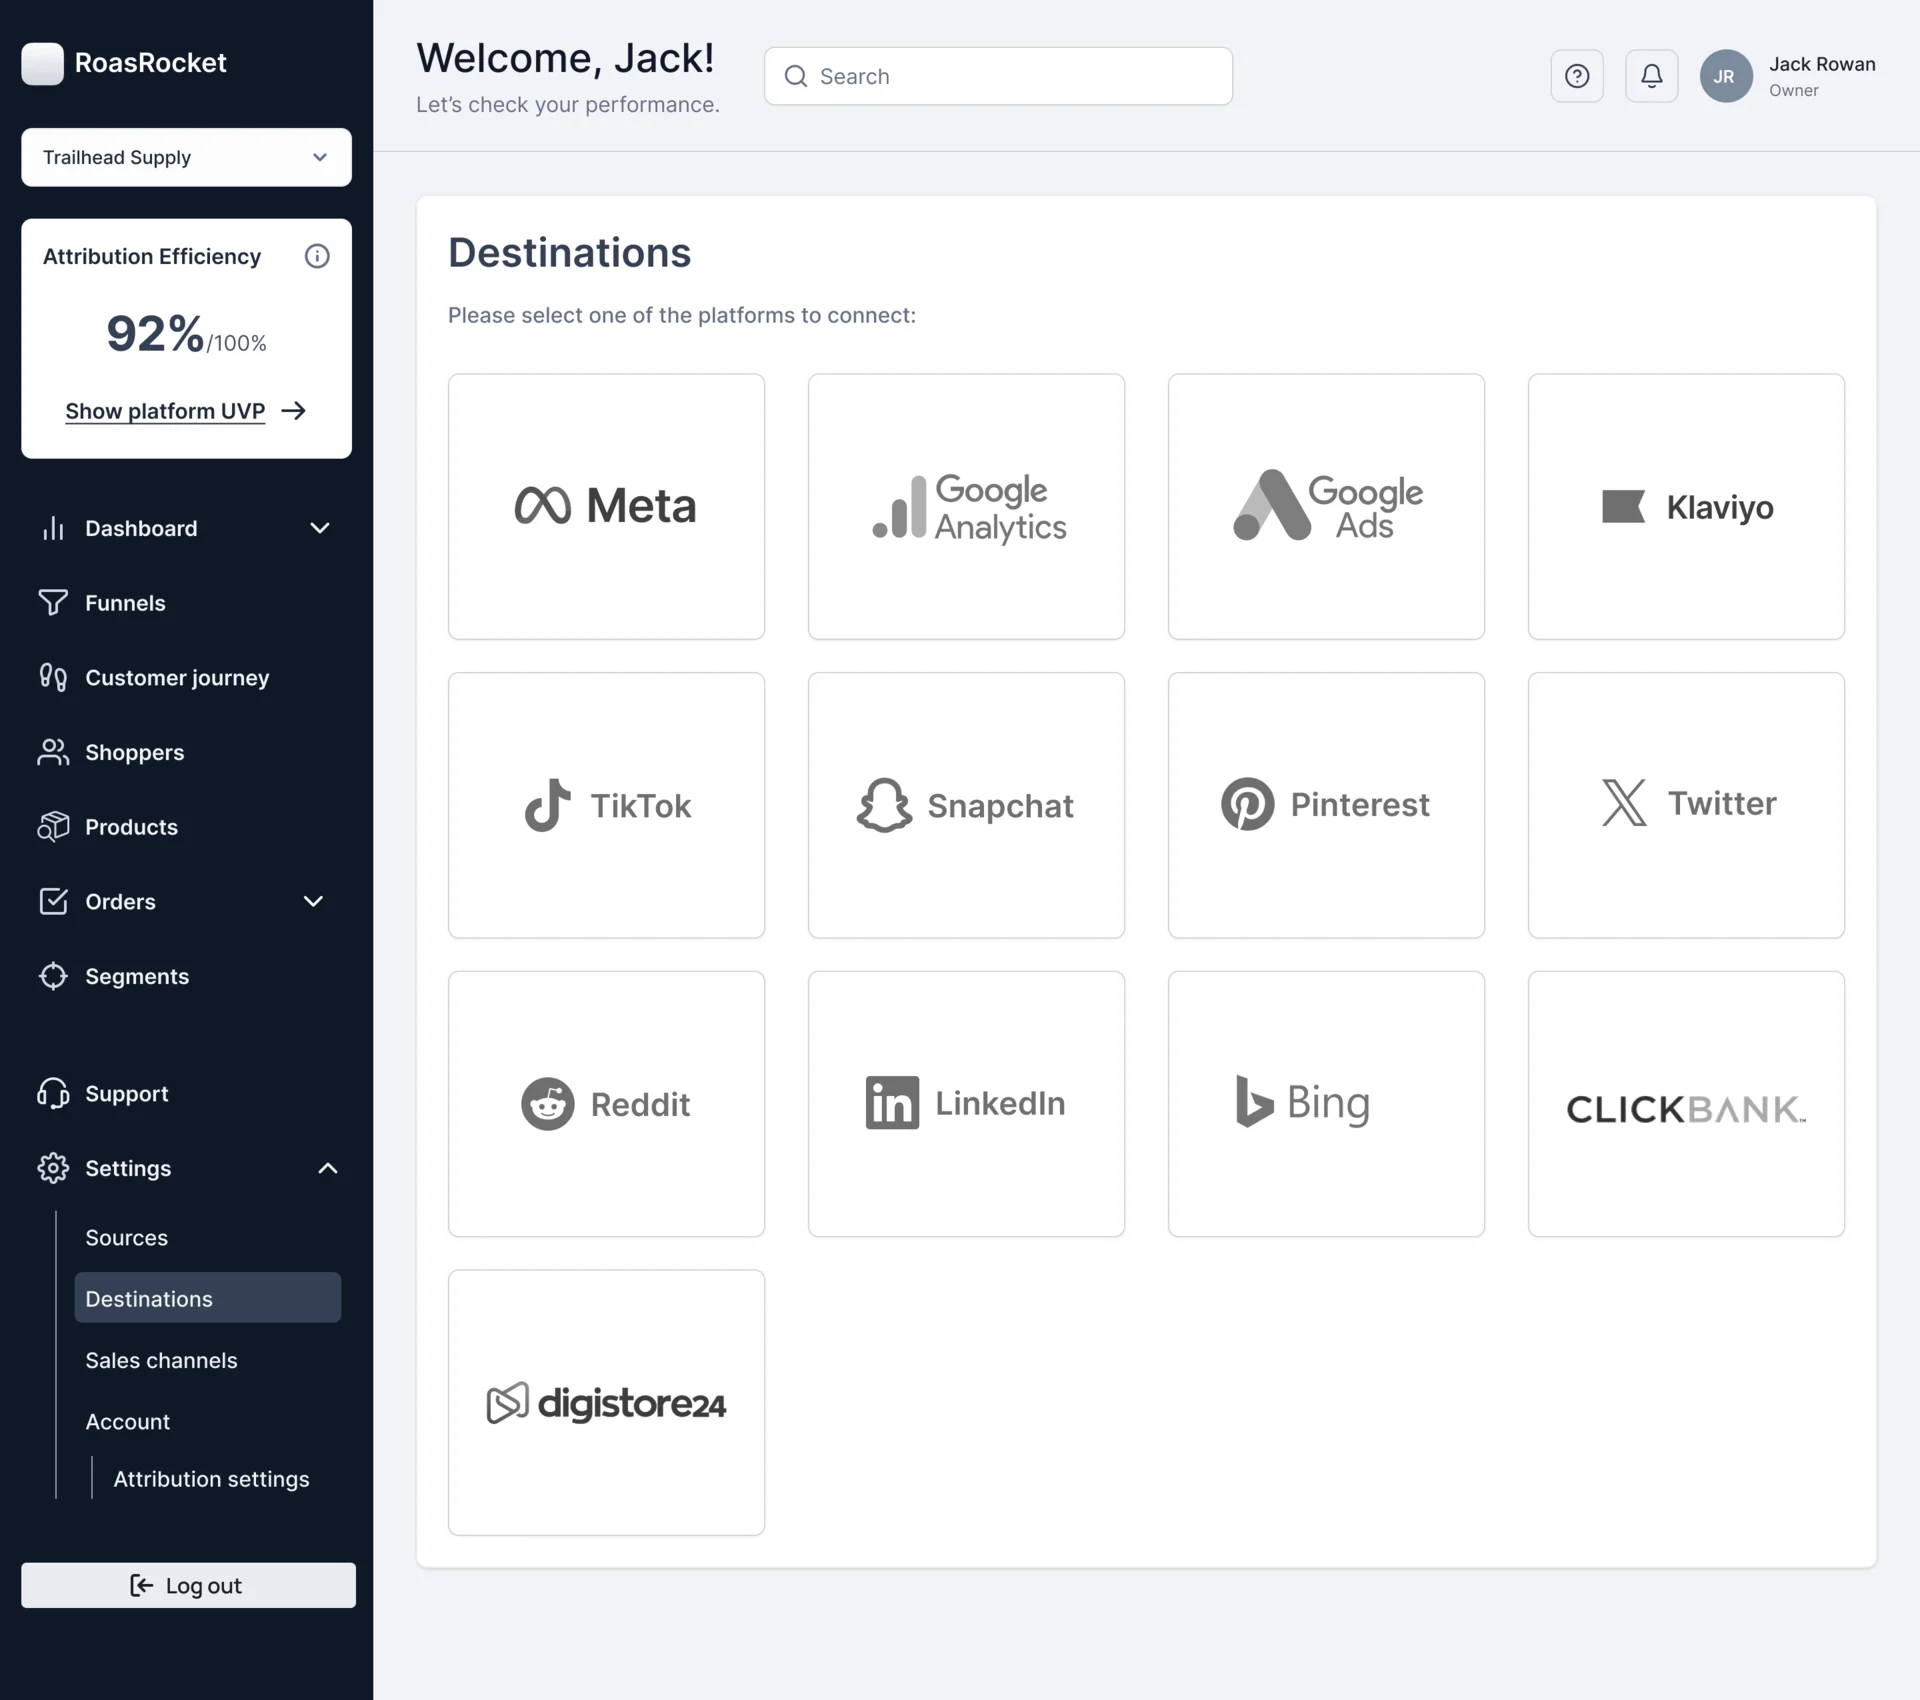
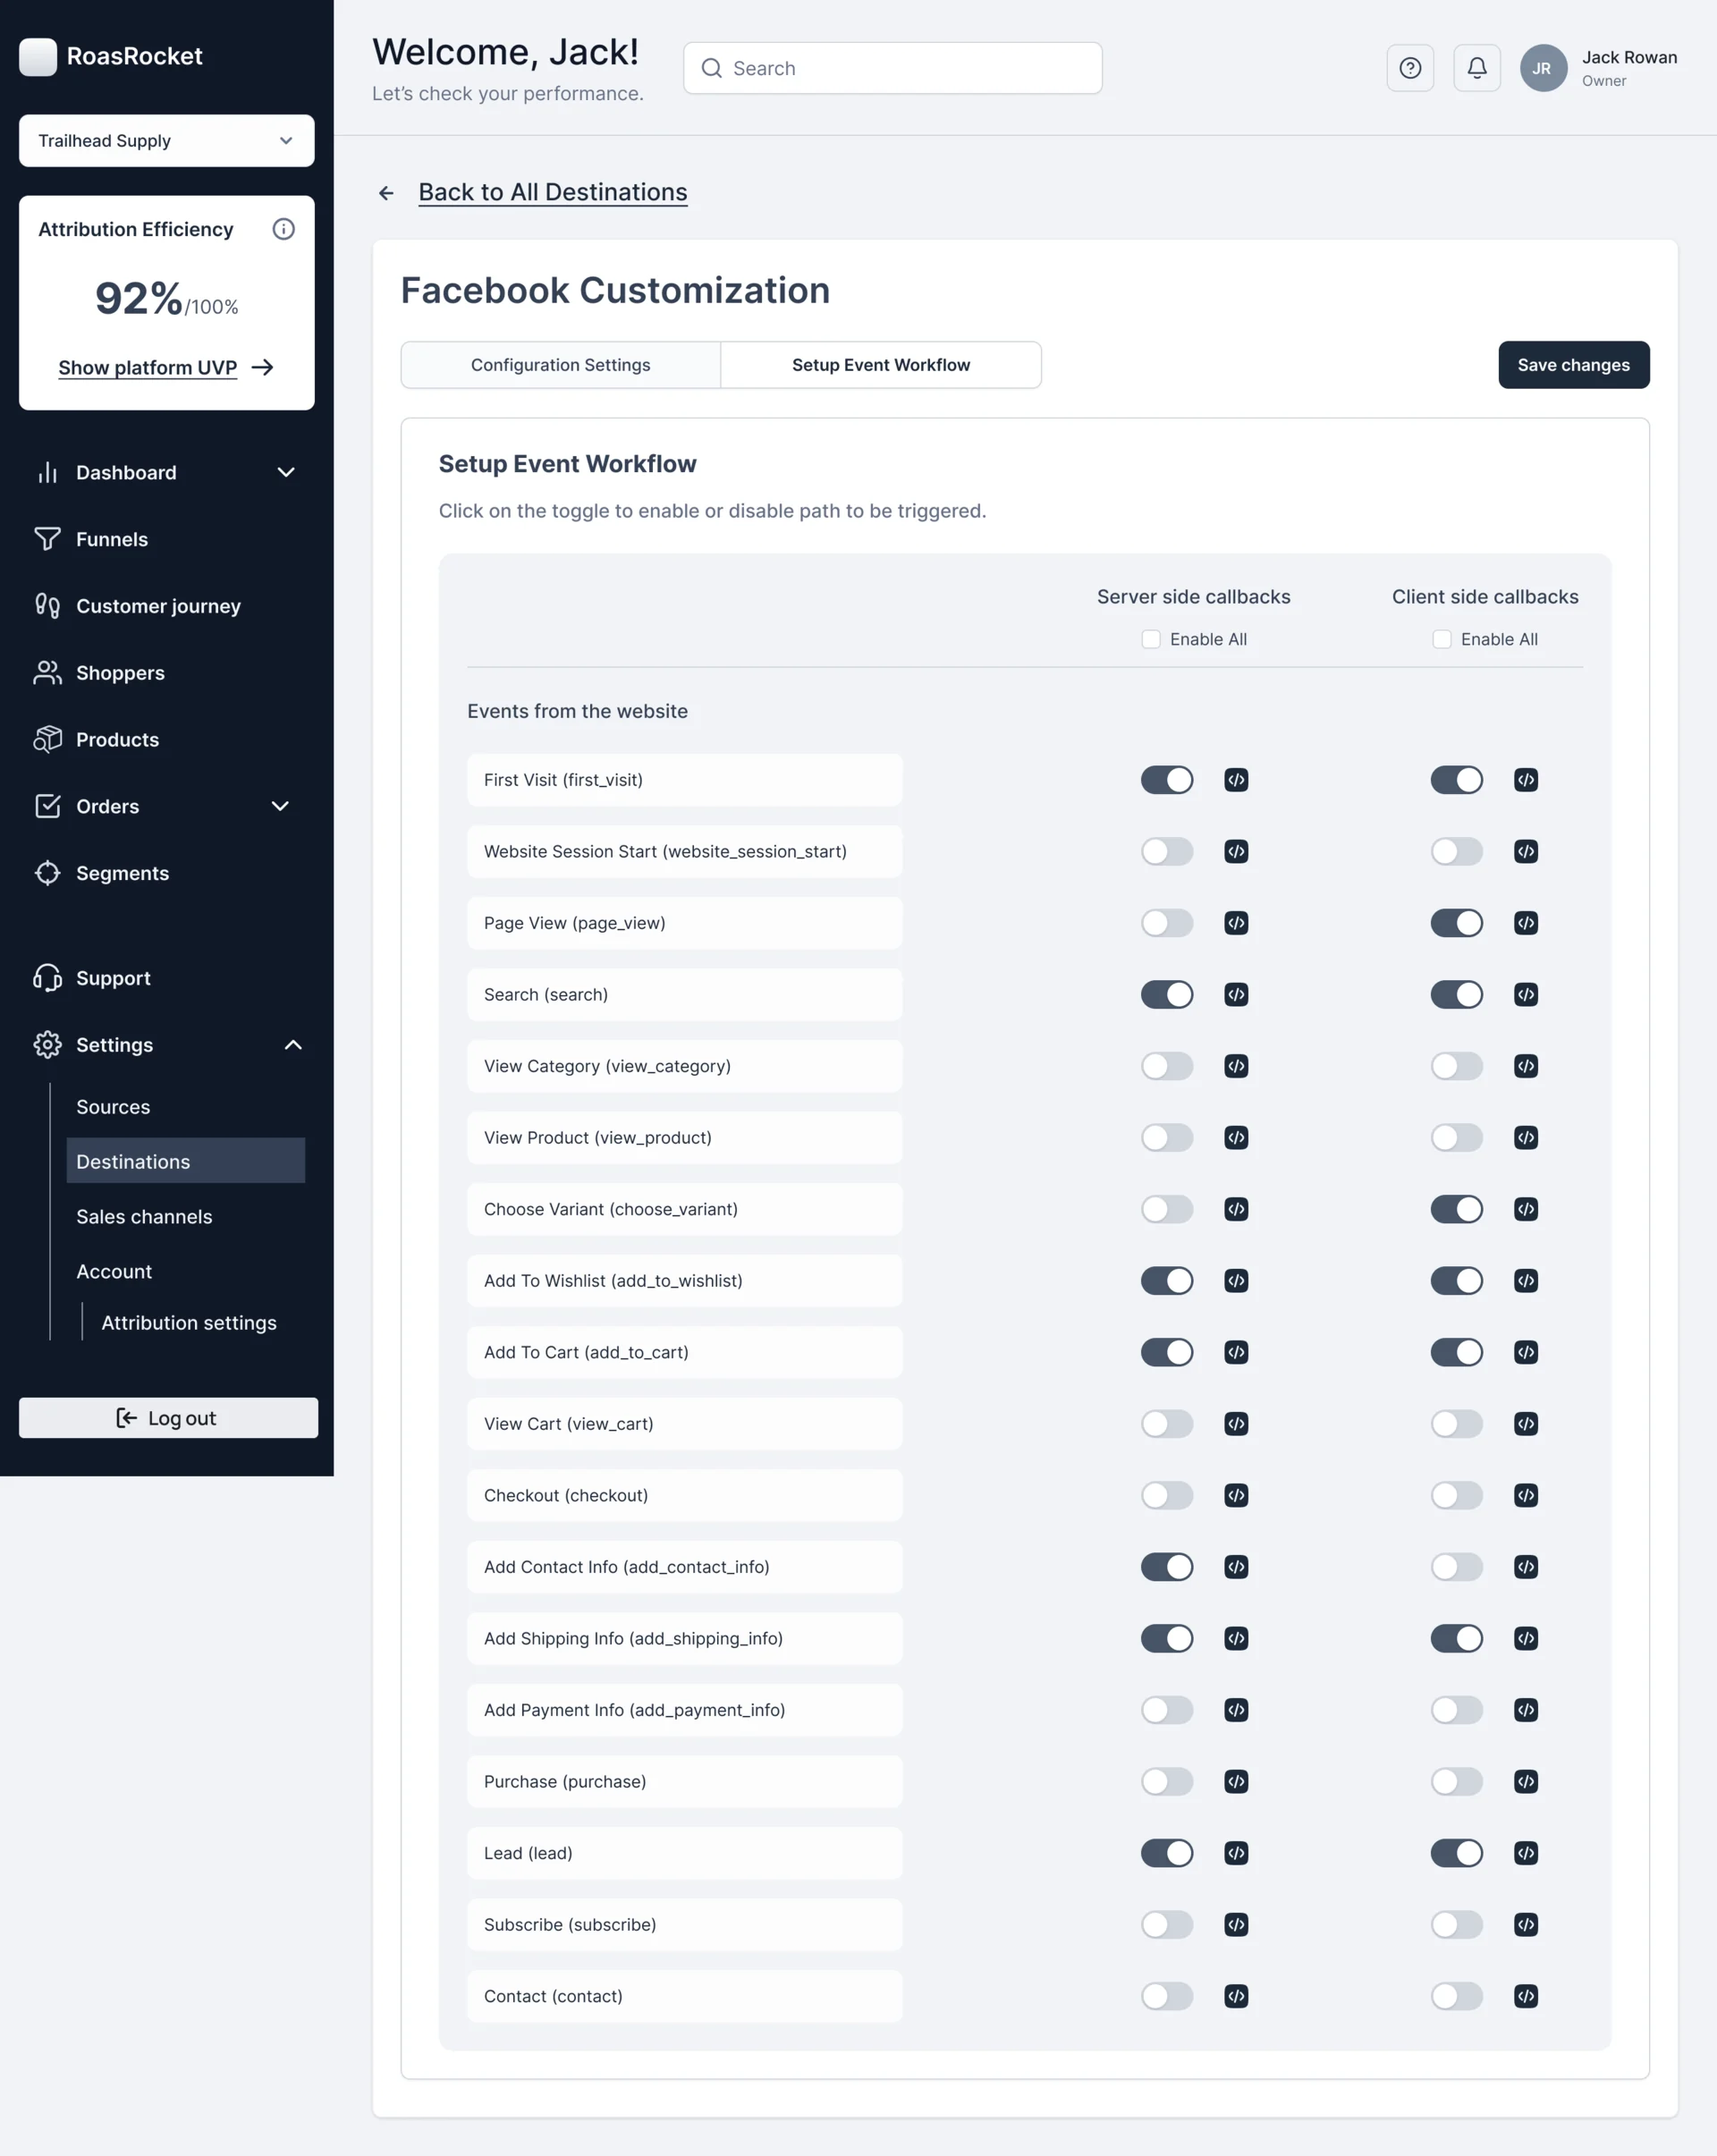
- Destinations as a grid of platforms; for each, an event workflow where every website event is switched on for server-side or client-side callbacks, with its code a click away.
Tracking set up in the first session
- Found
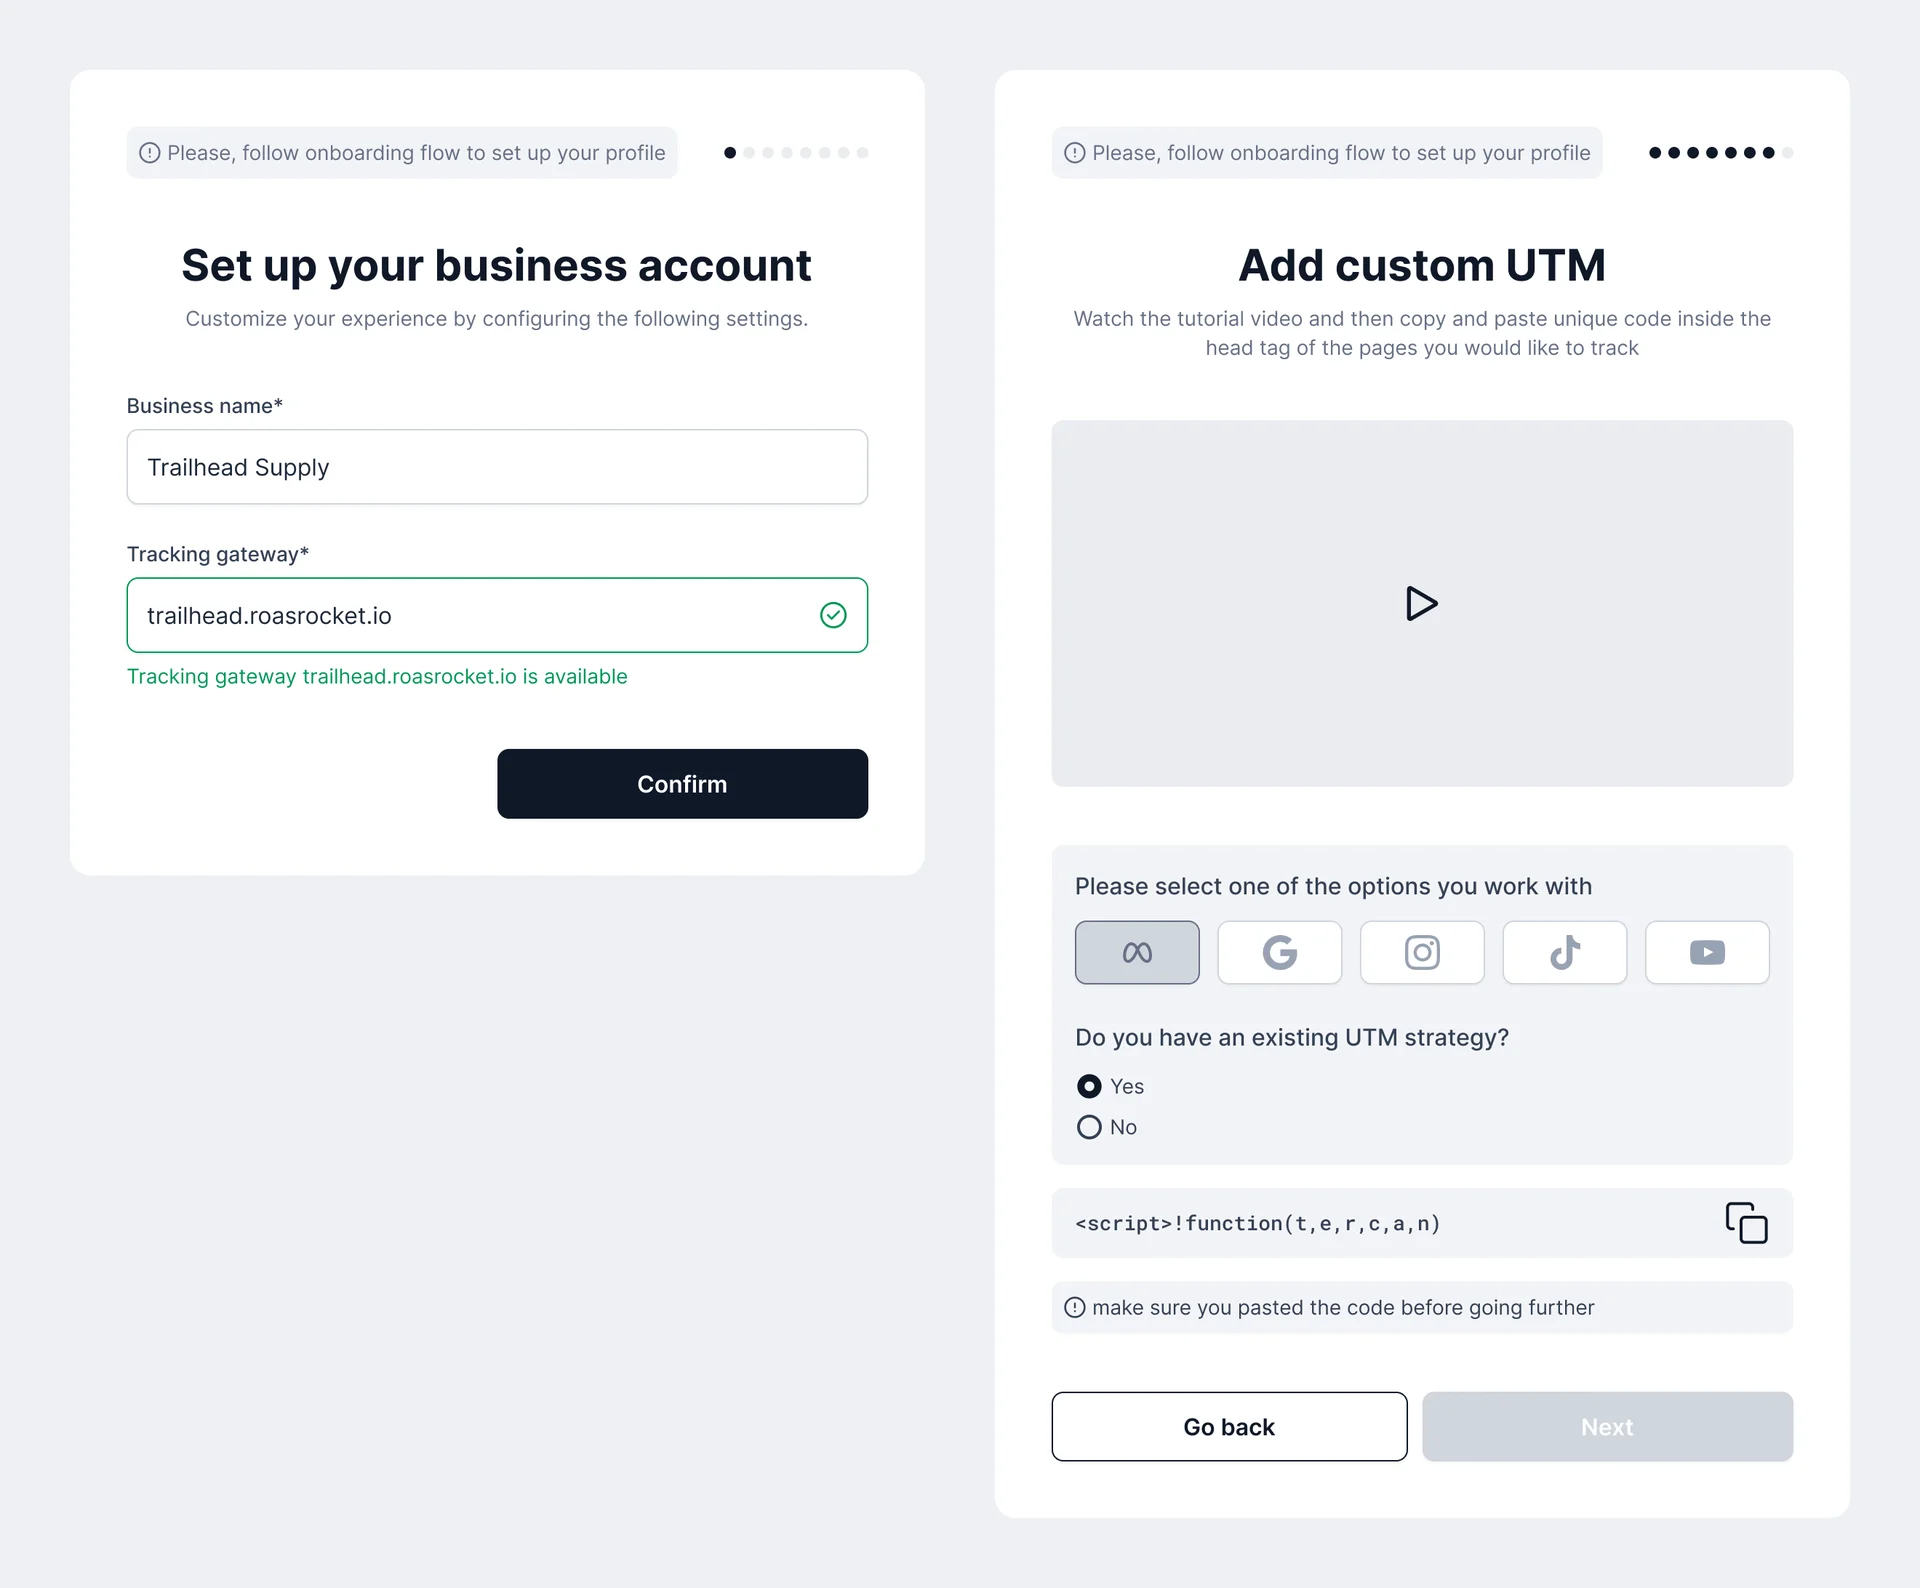
- Nothing is attributed until the tracking gateway, domain and script are in place, and a new account doesn’t know that yet.
- Decided
- Onboarding as a short series of steps: the business and its tracking gateway, checked as it’s typed, the domain, then the platforms used and the script to paste, with a tutorial beside it.
The catalogue behind every sale
- Found
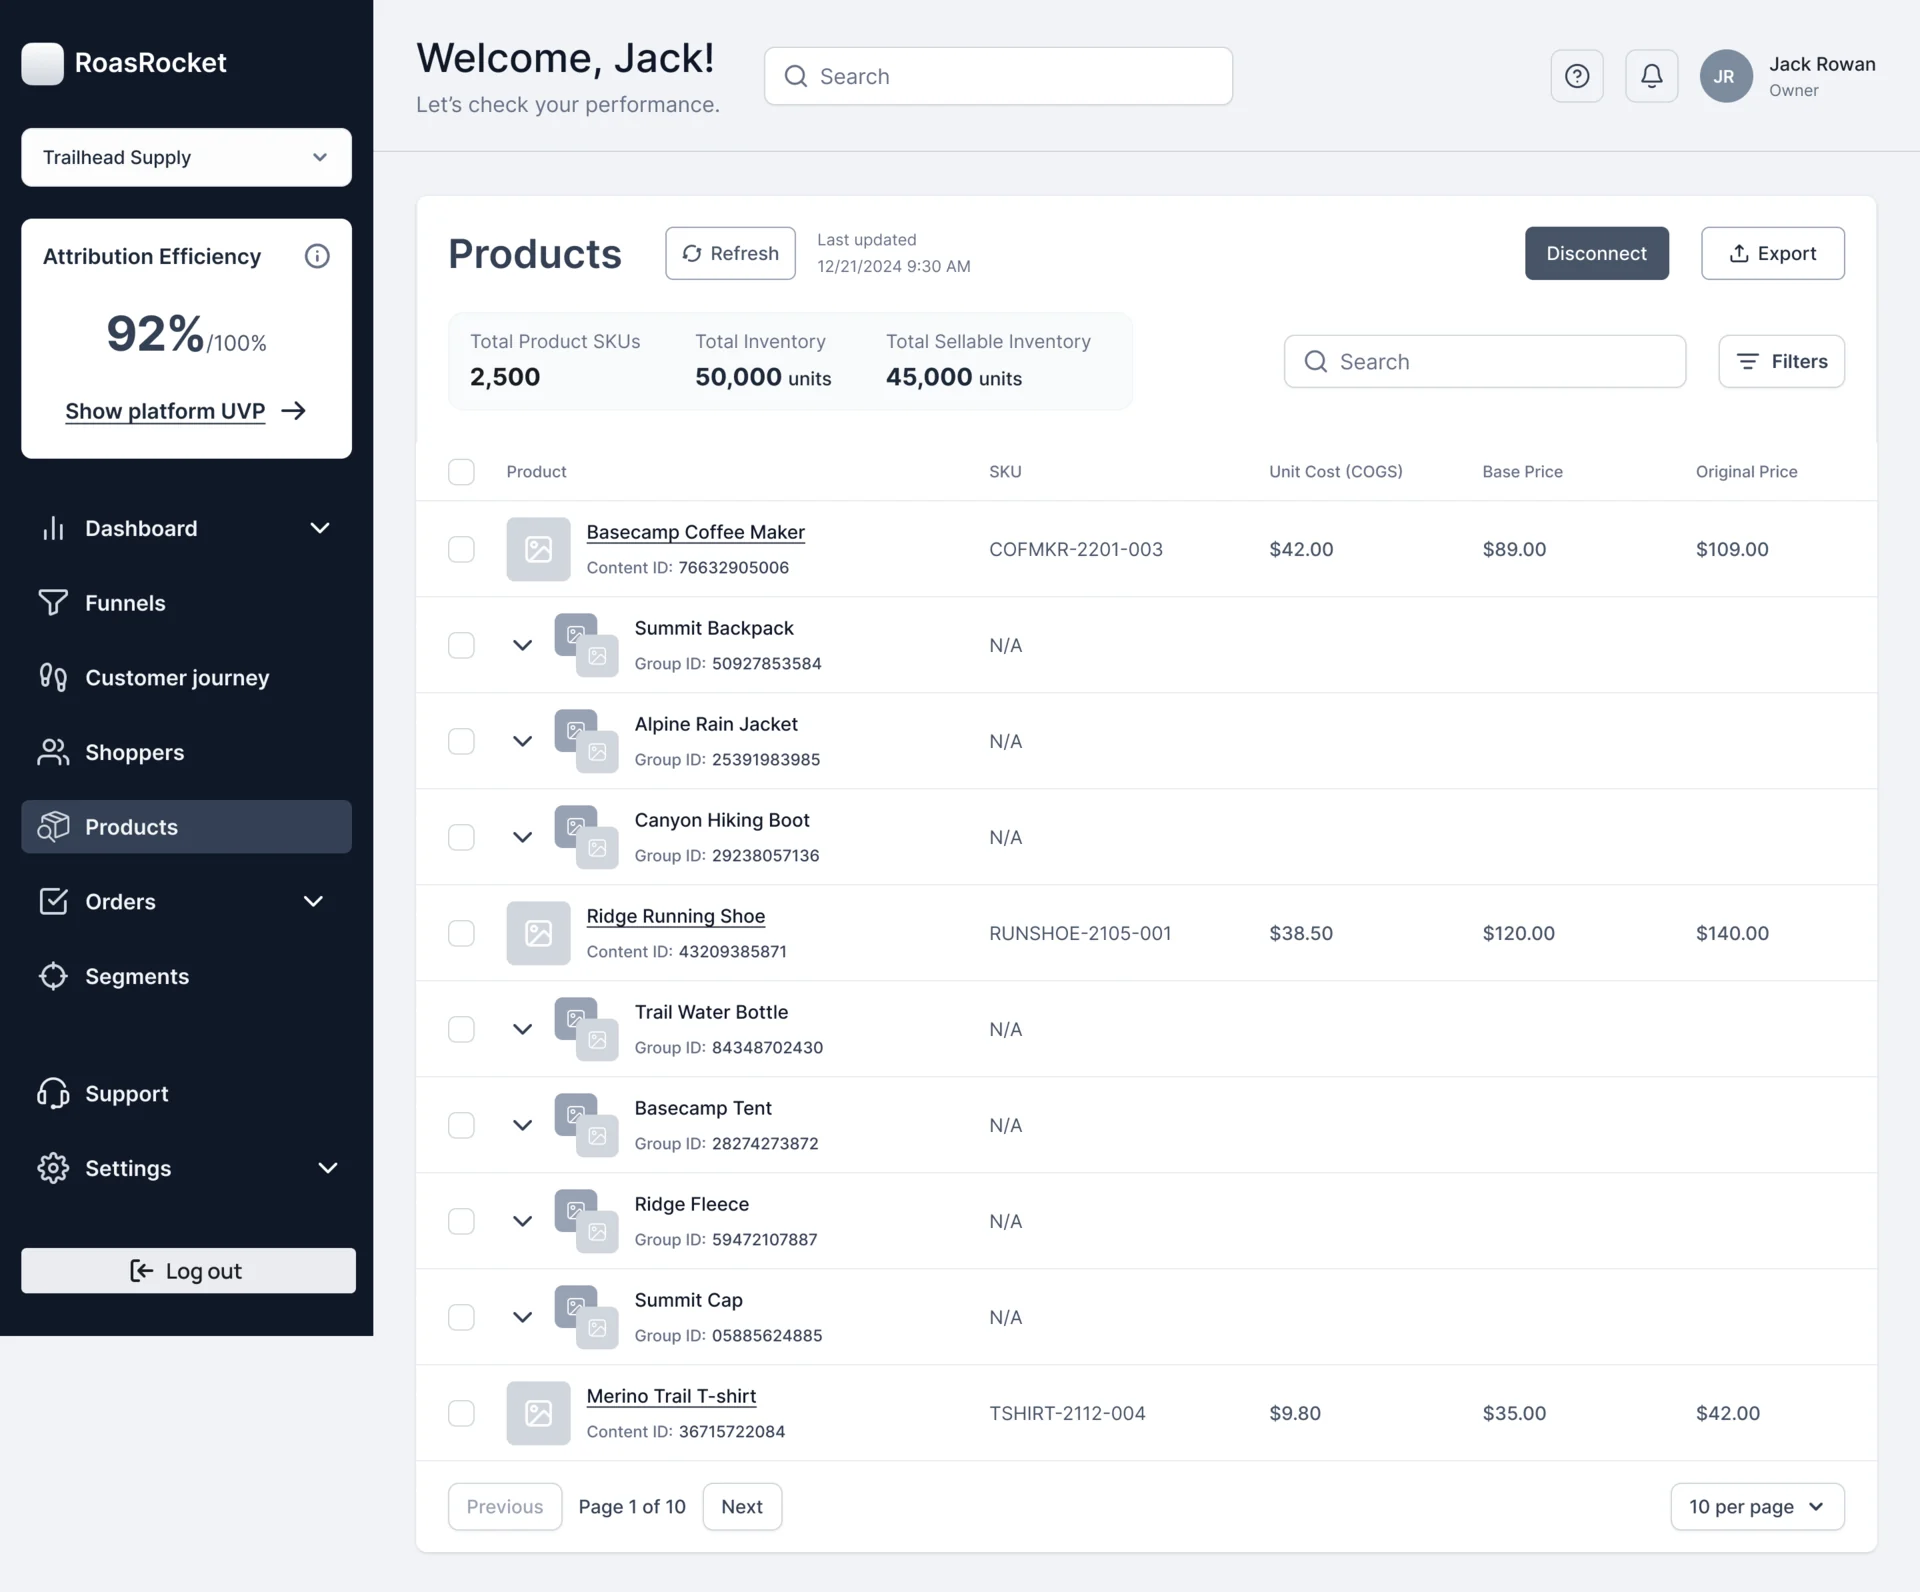
- Attribution stops at the order unless the platform knows what was sold, and a store’s catalogue comes in from Shopify, a feed or a file.
- Decided
- Products imported from the store with totals for SKUs and inventory, grouped products that open into their variants, costs next to prices, and export back to the ad platforms.
Orders a team can follow up
- Found
- An order is where attribution ends and customer service starts, and abandoned carts are revenue still on the table.
- Decided
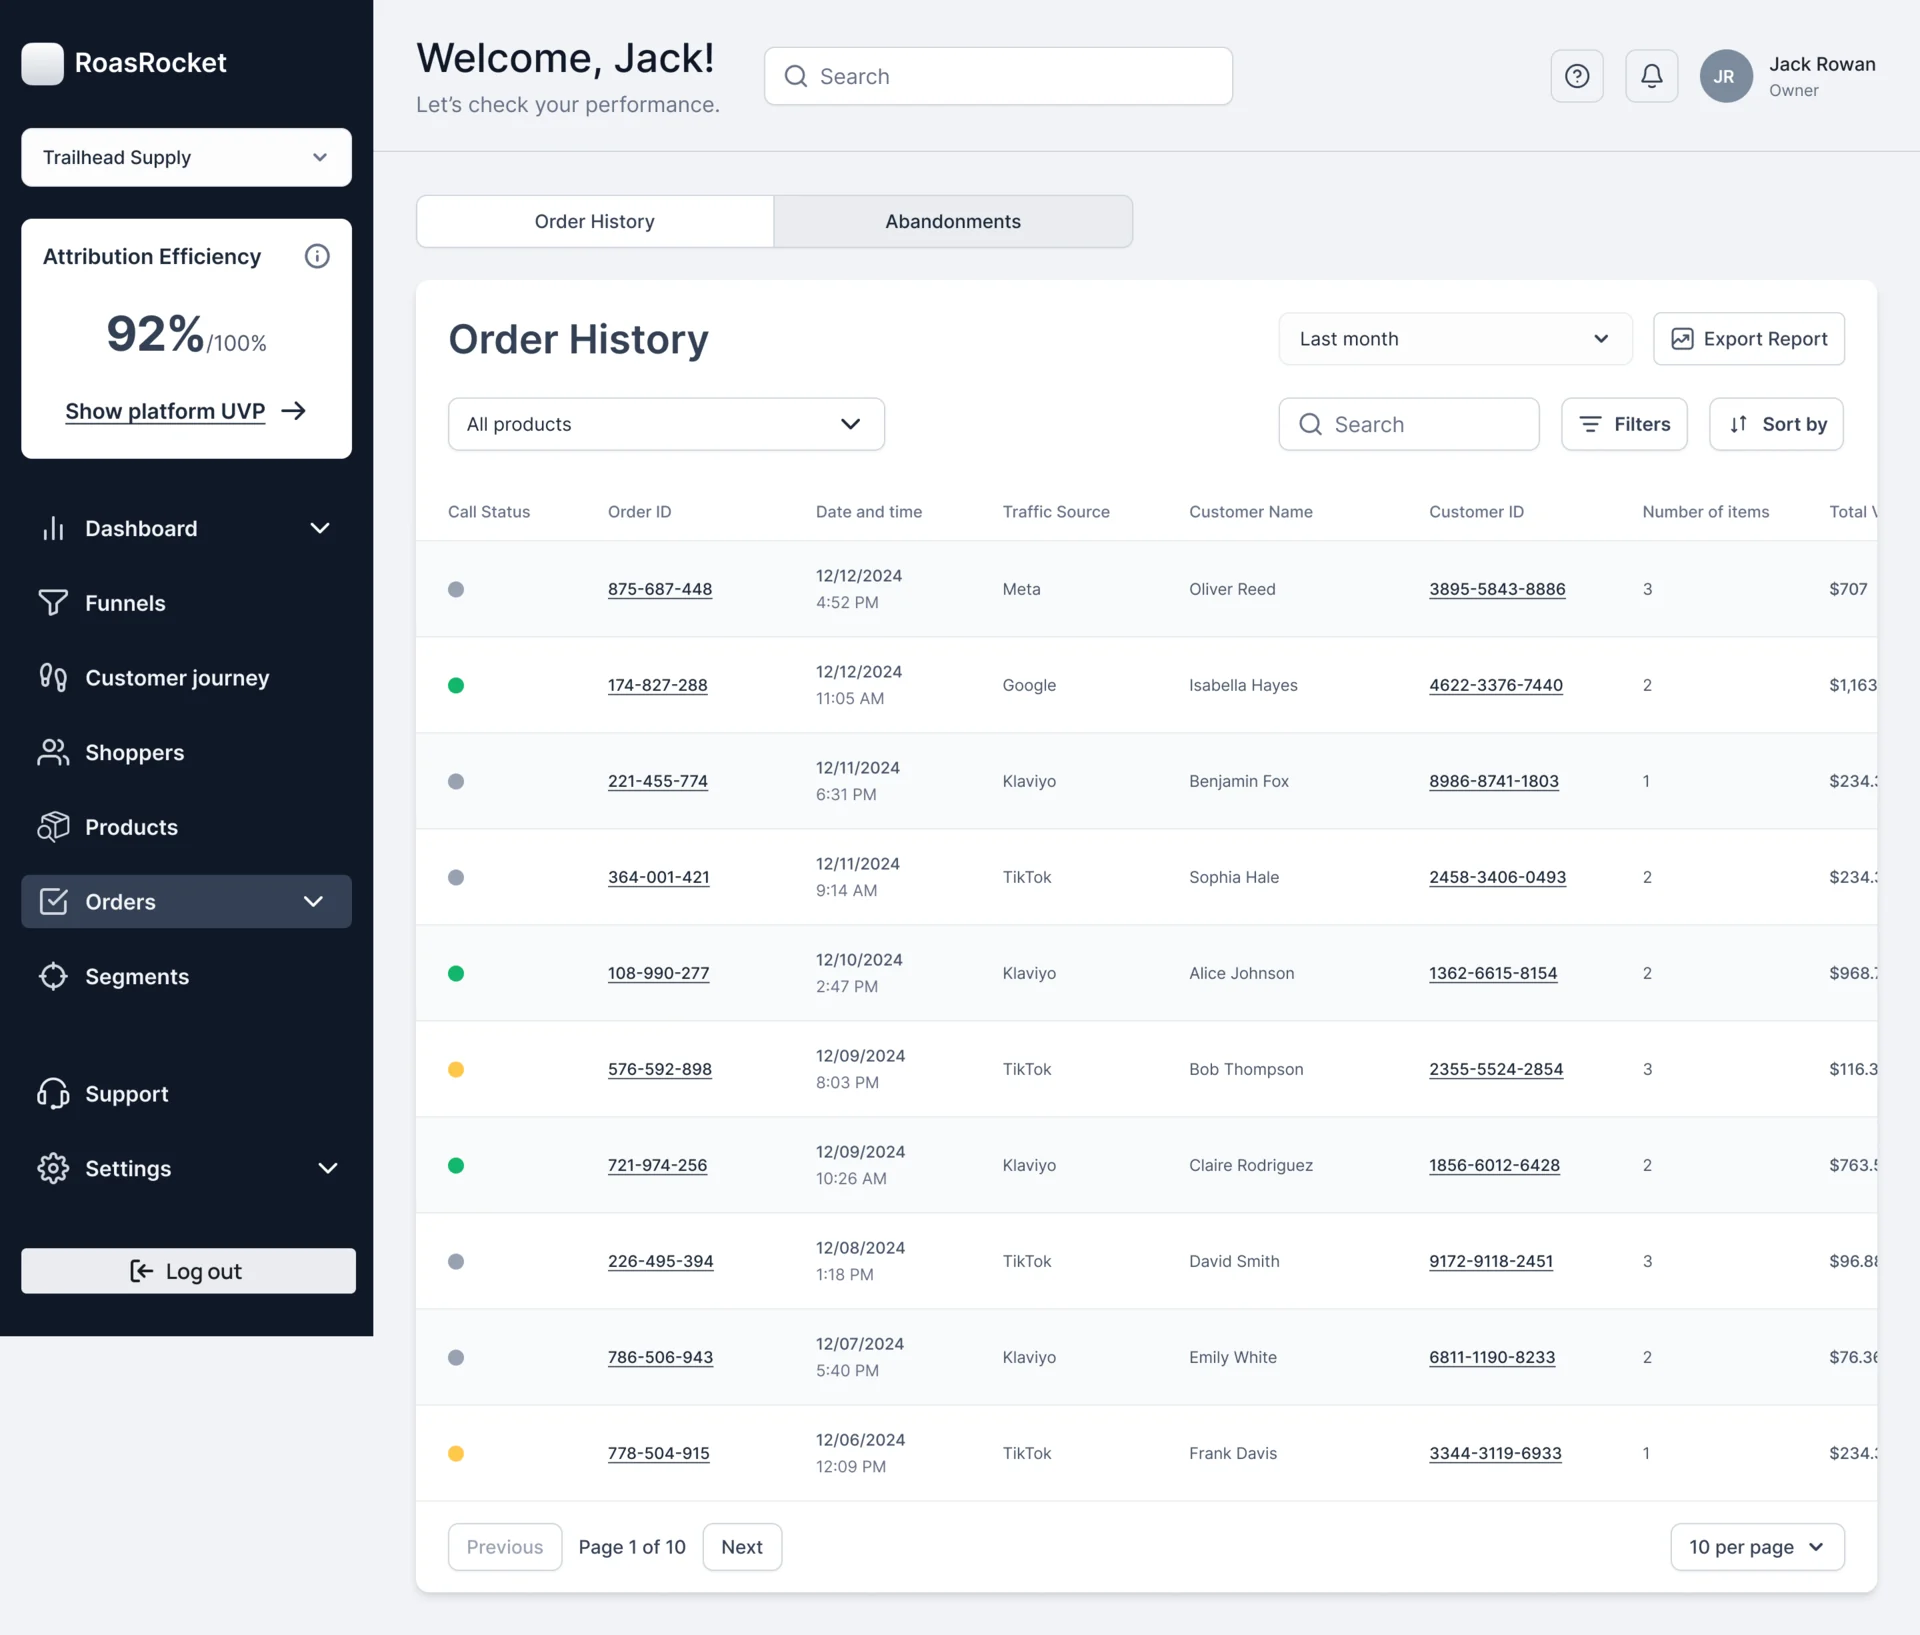
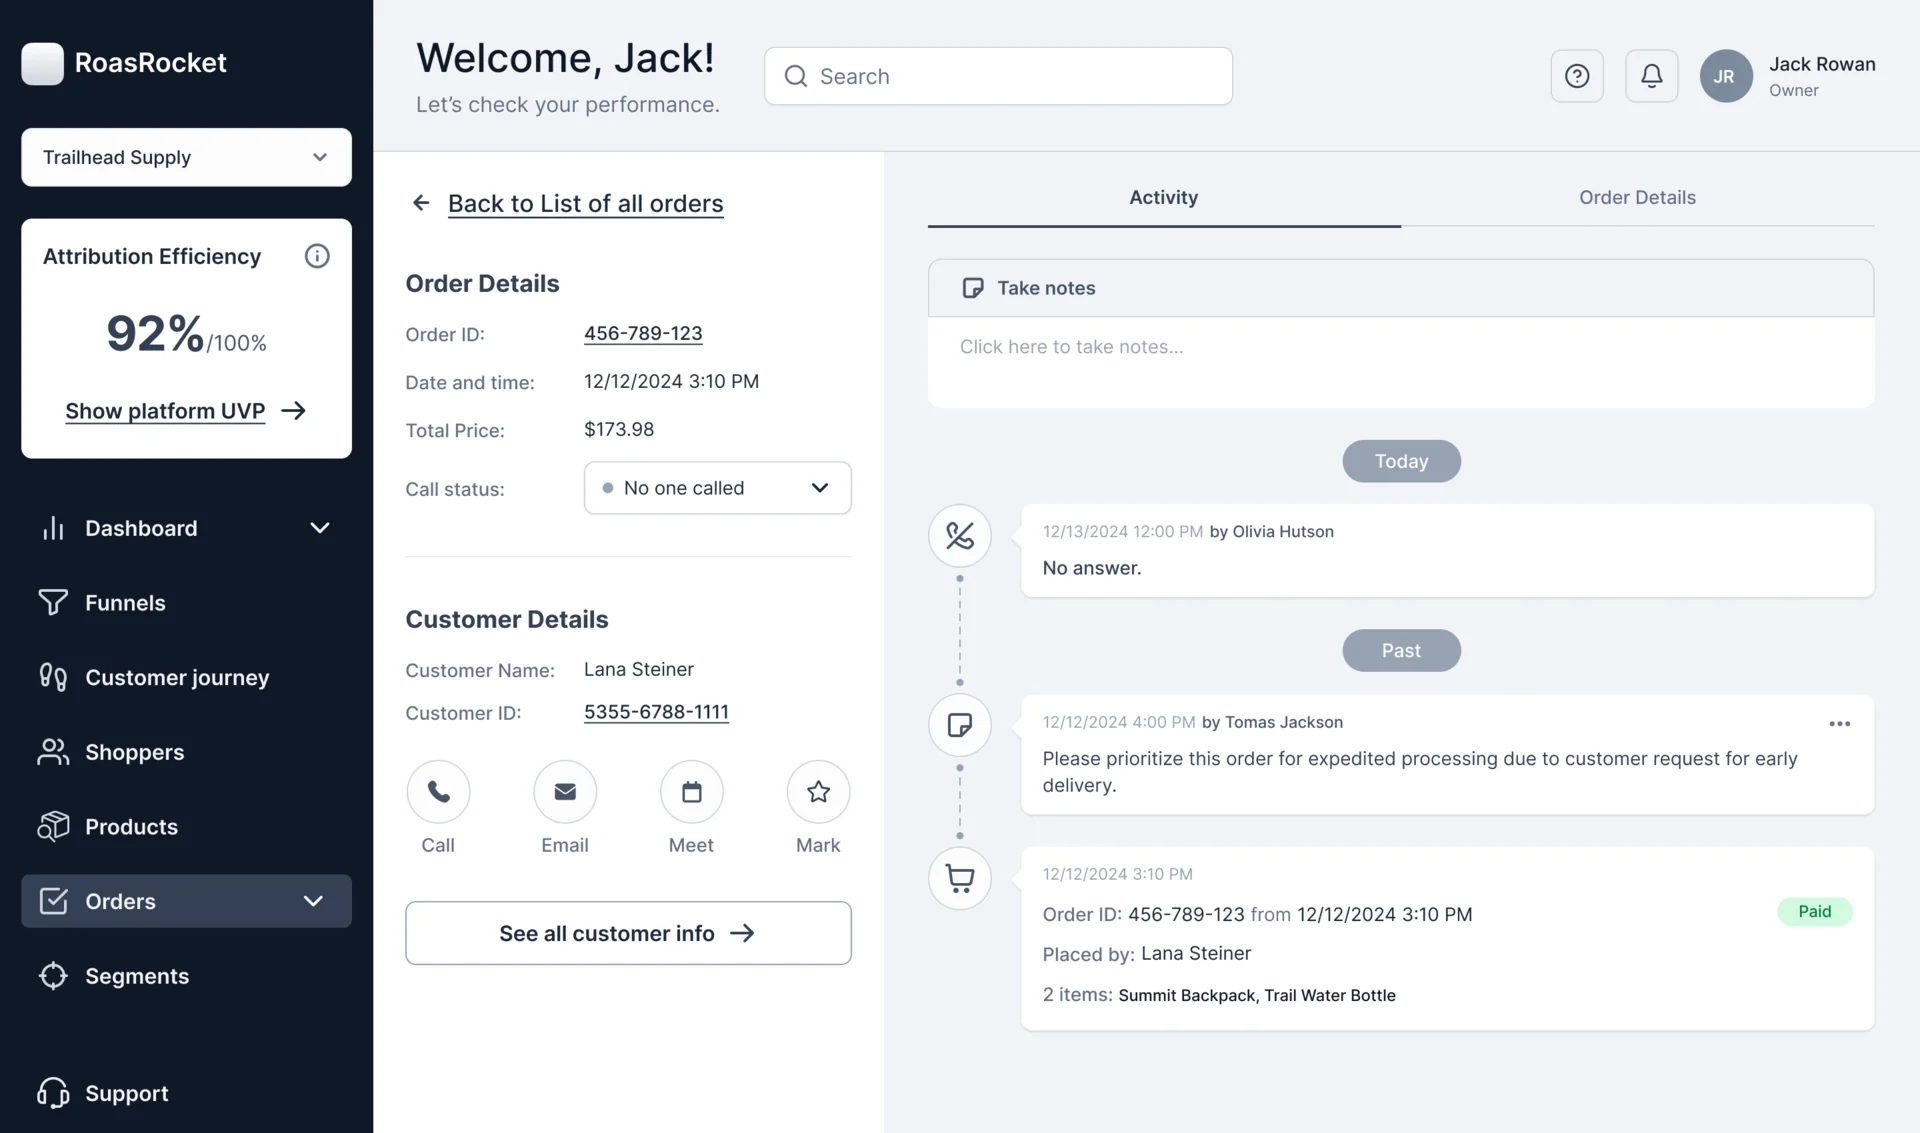
- Order history with source, customer and value on every row and abandonments in their own tab; each order record keeps its call status, notes and activity next to the customer.
A design system for rules, tables and states
- Found
- Sources, events, parameters and segments are all defined by rules, and four rule editors drawn separately would teach the same thing four ways.
- Decided
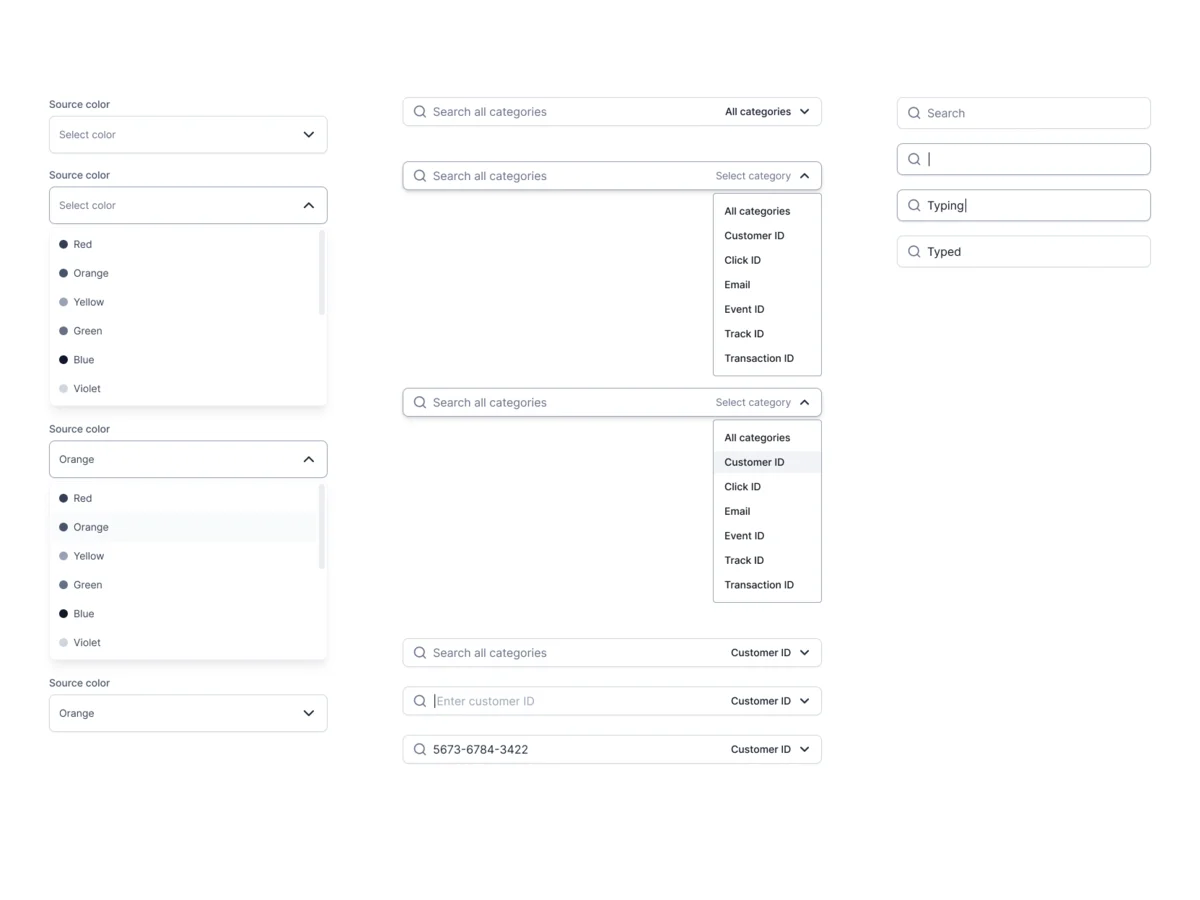
- A full design system and UI kit: one condition builder, one table, one set of fields and states, reused across analysis, setup and billing.
One condition builder, two jobs
The same rows of component, condition and value define a custom traffic source and a custom event.
-
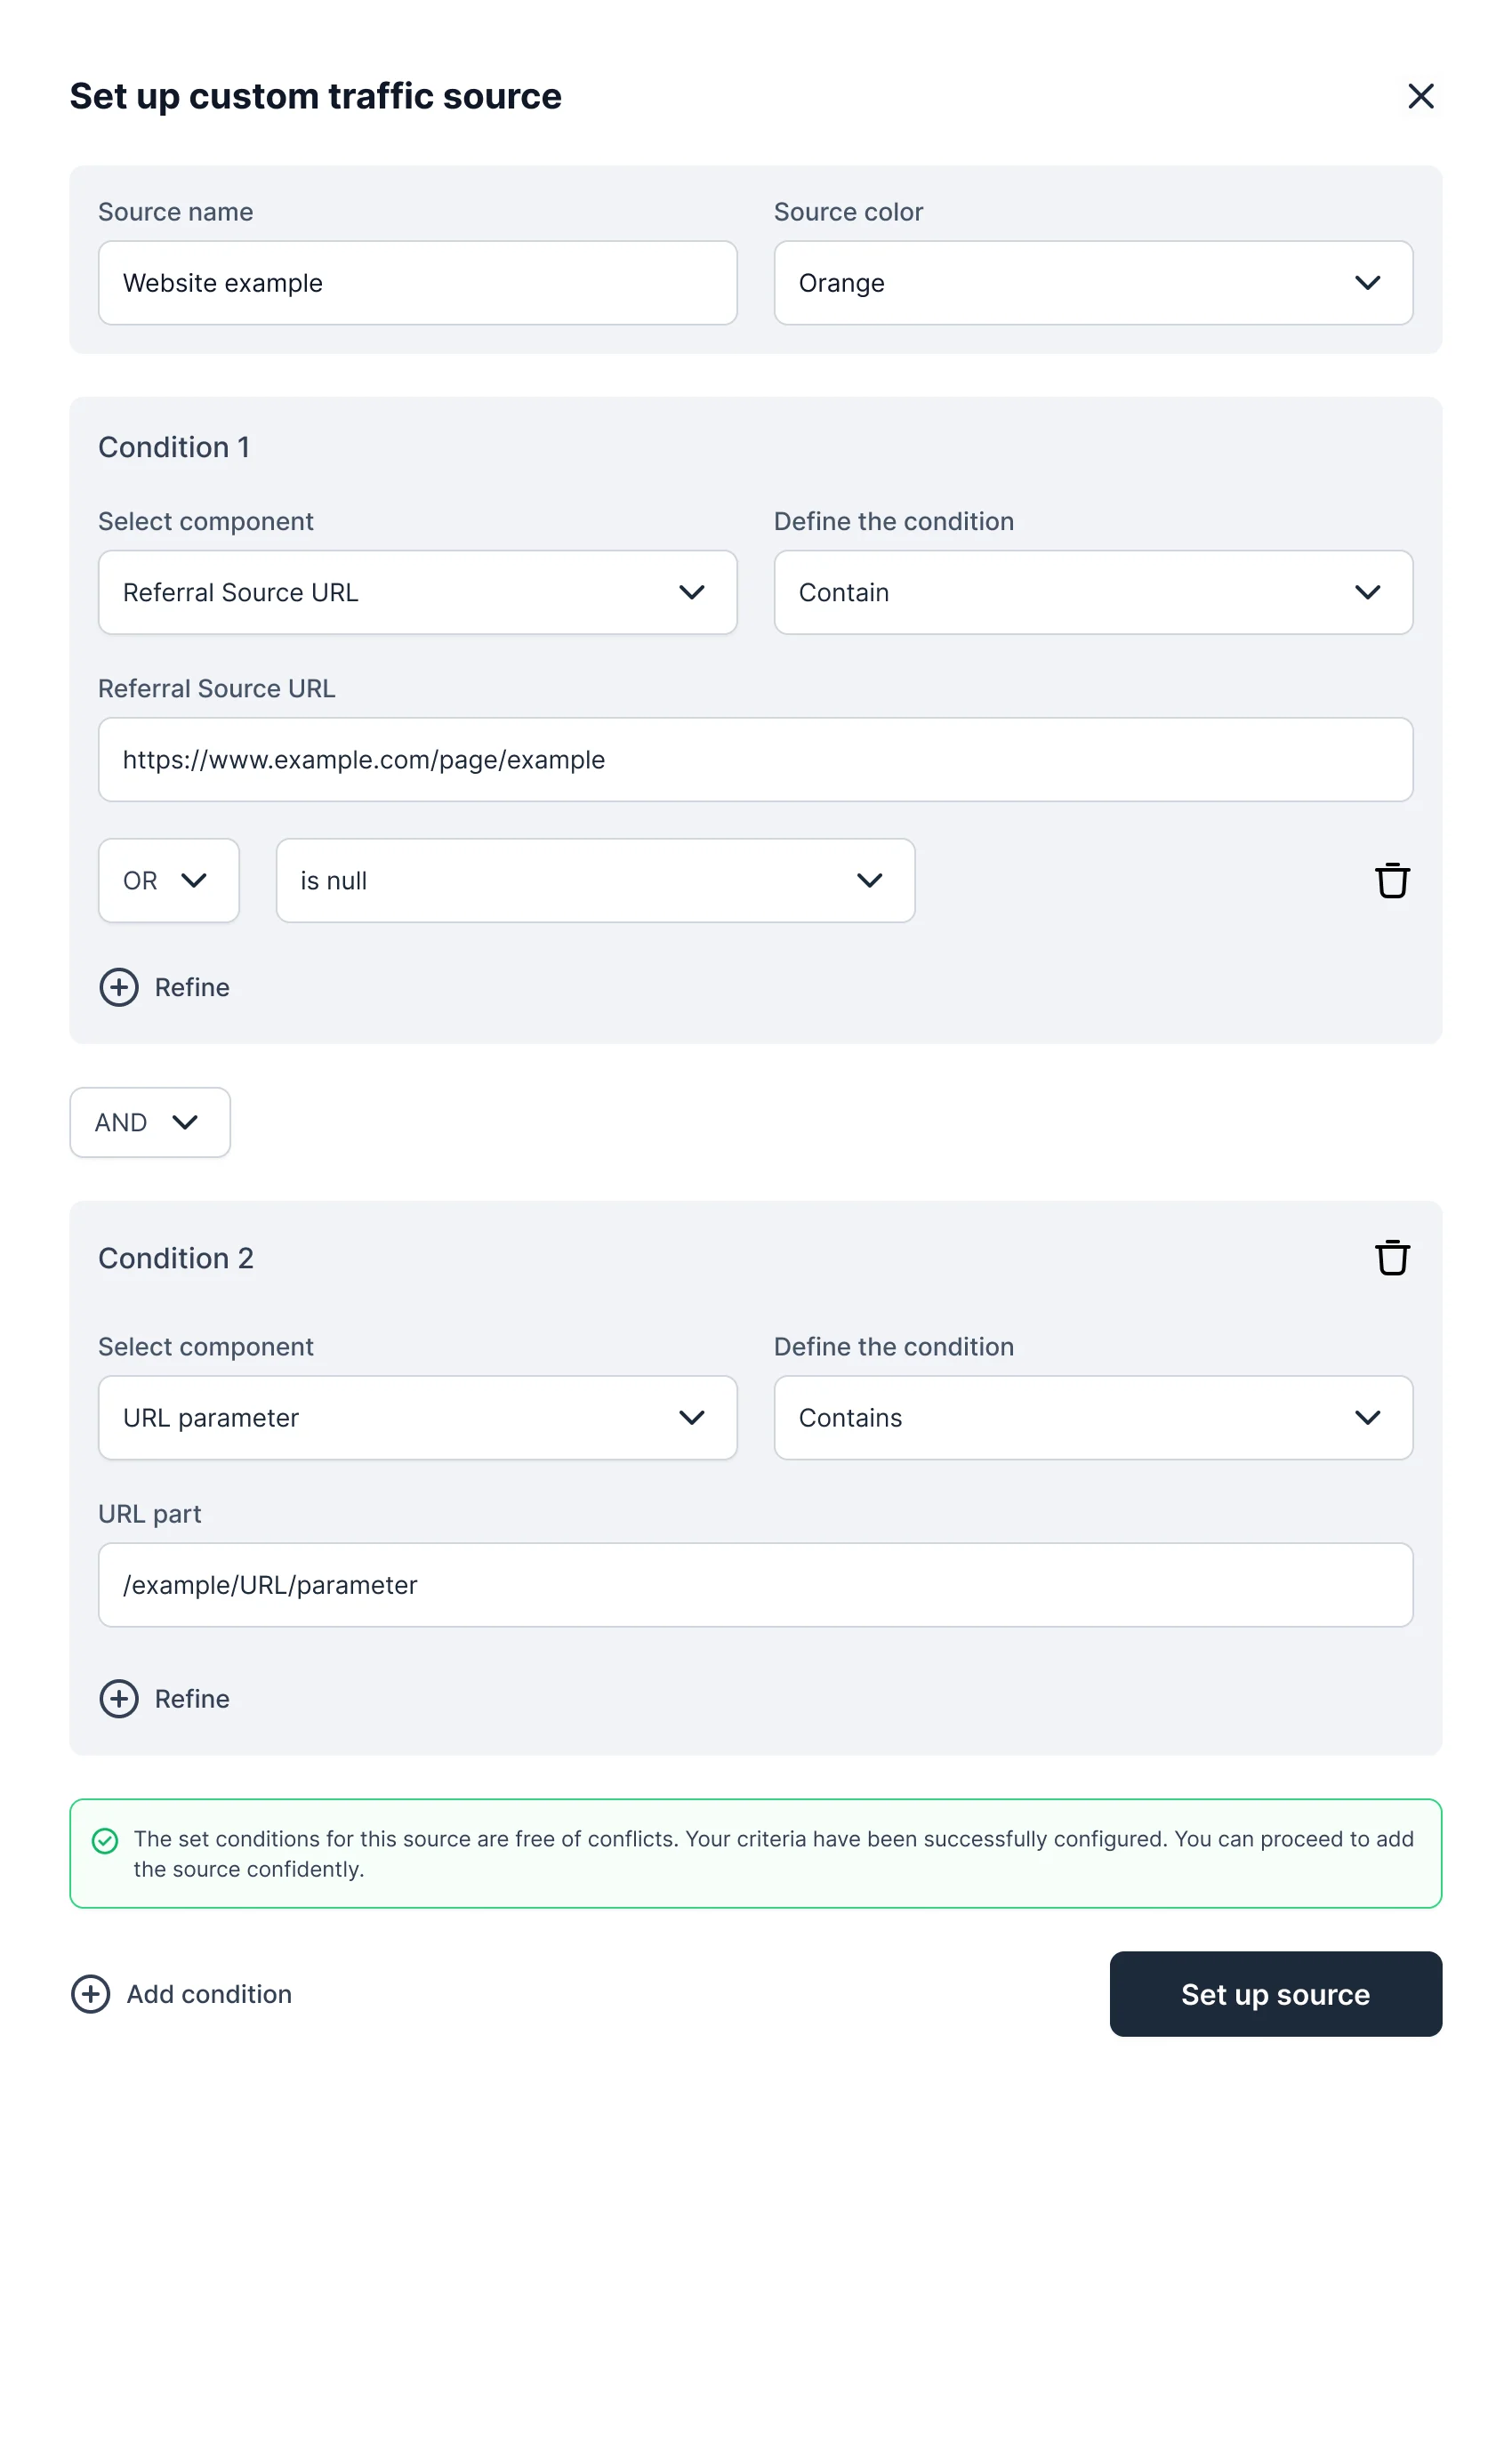
Custom source: Where a visit came from. -
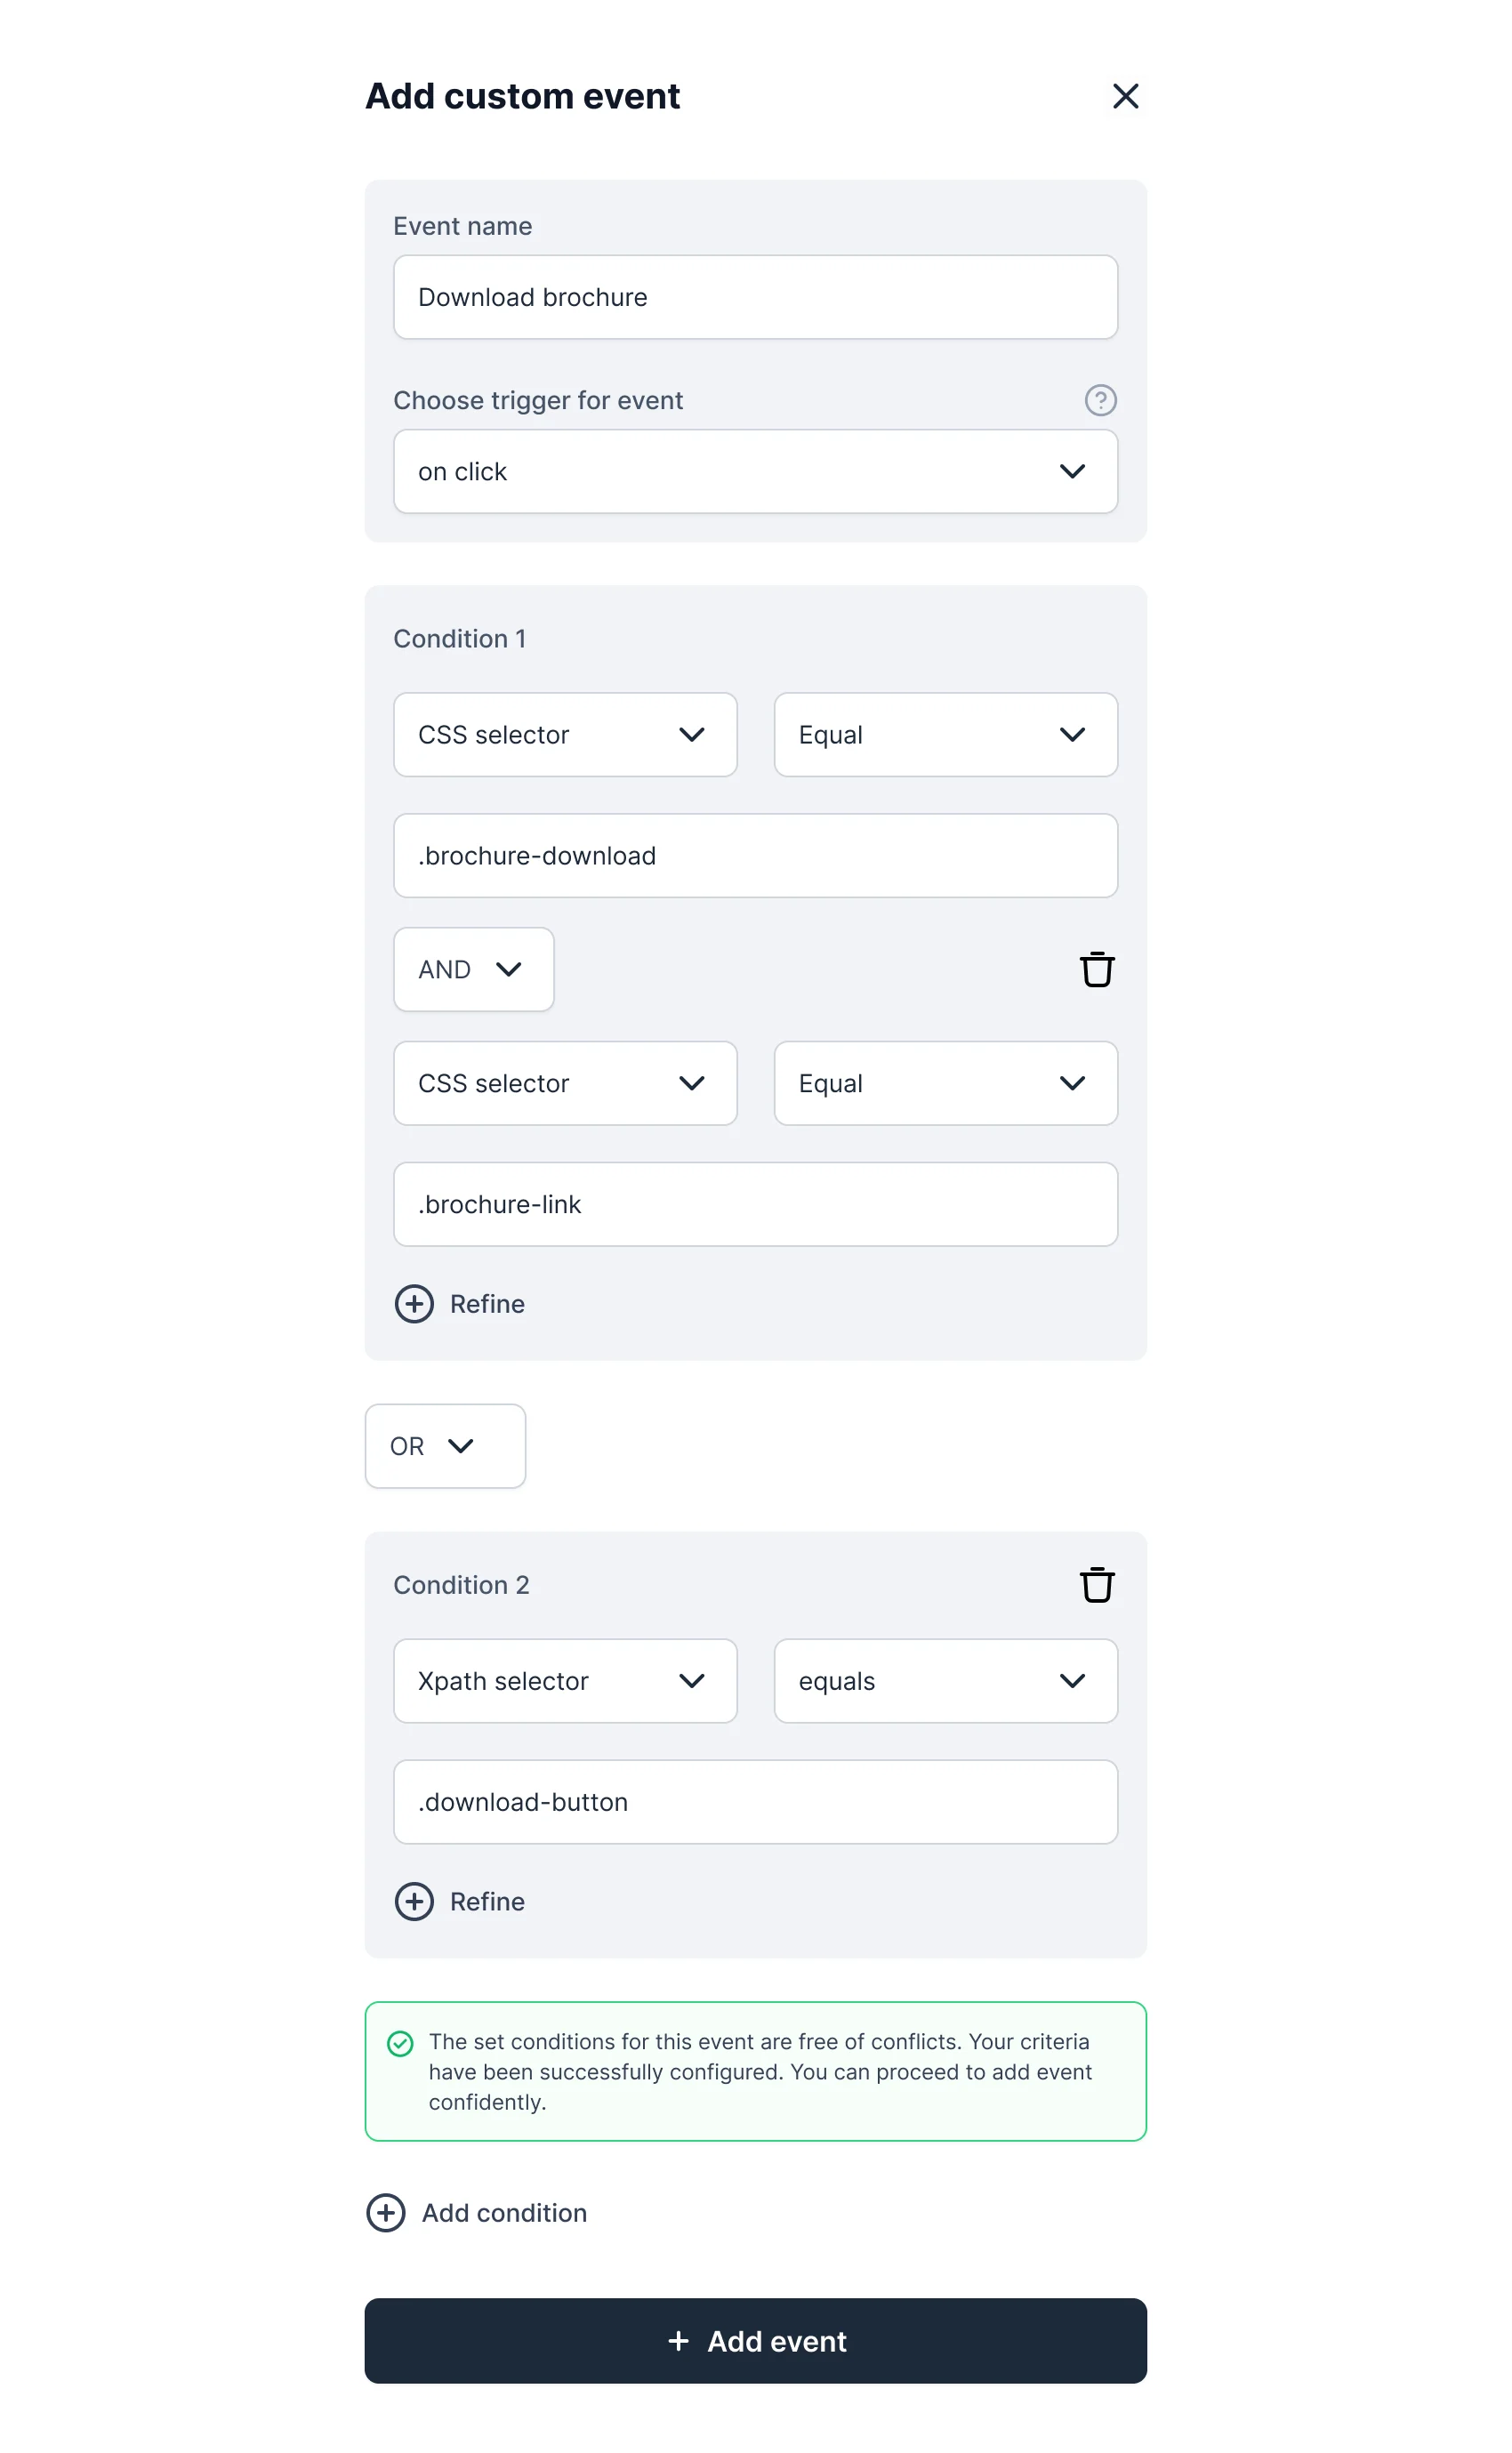
Custom event: What counts as an event.
A new parameter, checked before it’s saved
Left, conditions free of conflicts, ready to save; right, the same conditions in conflict, marked in place.
-
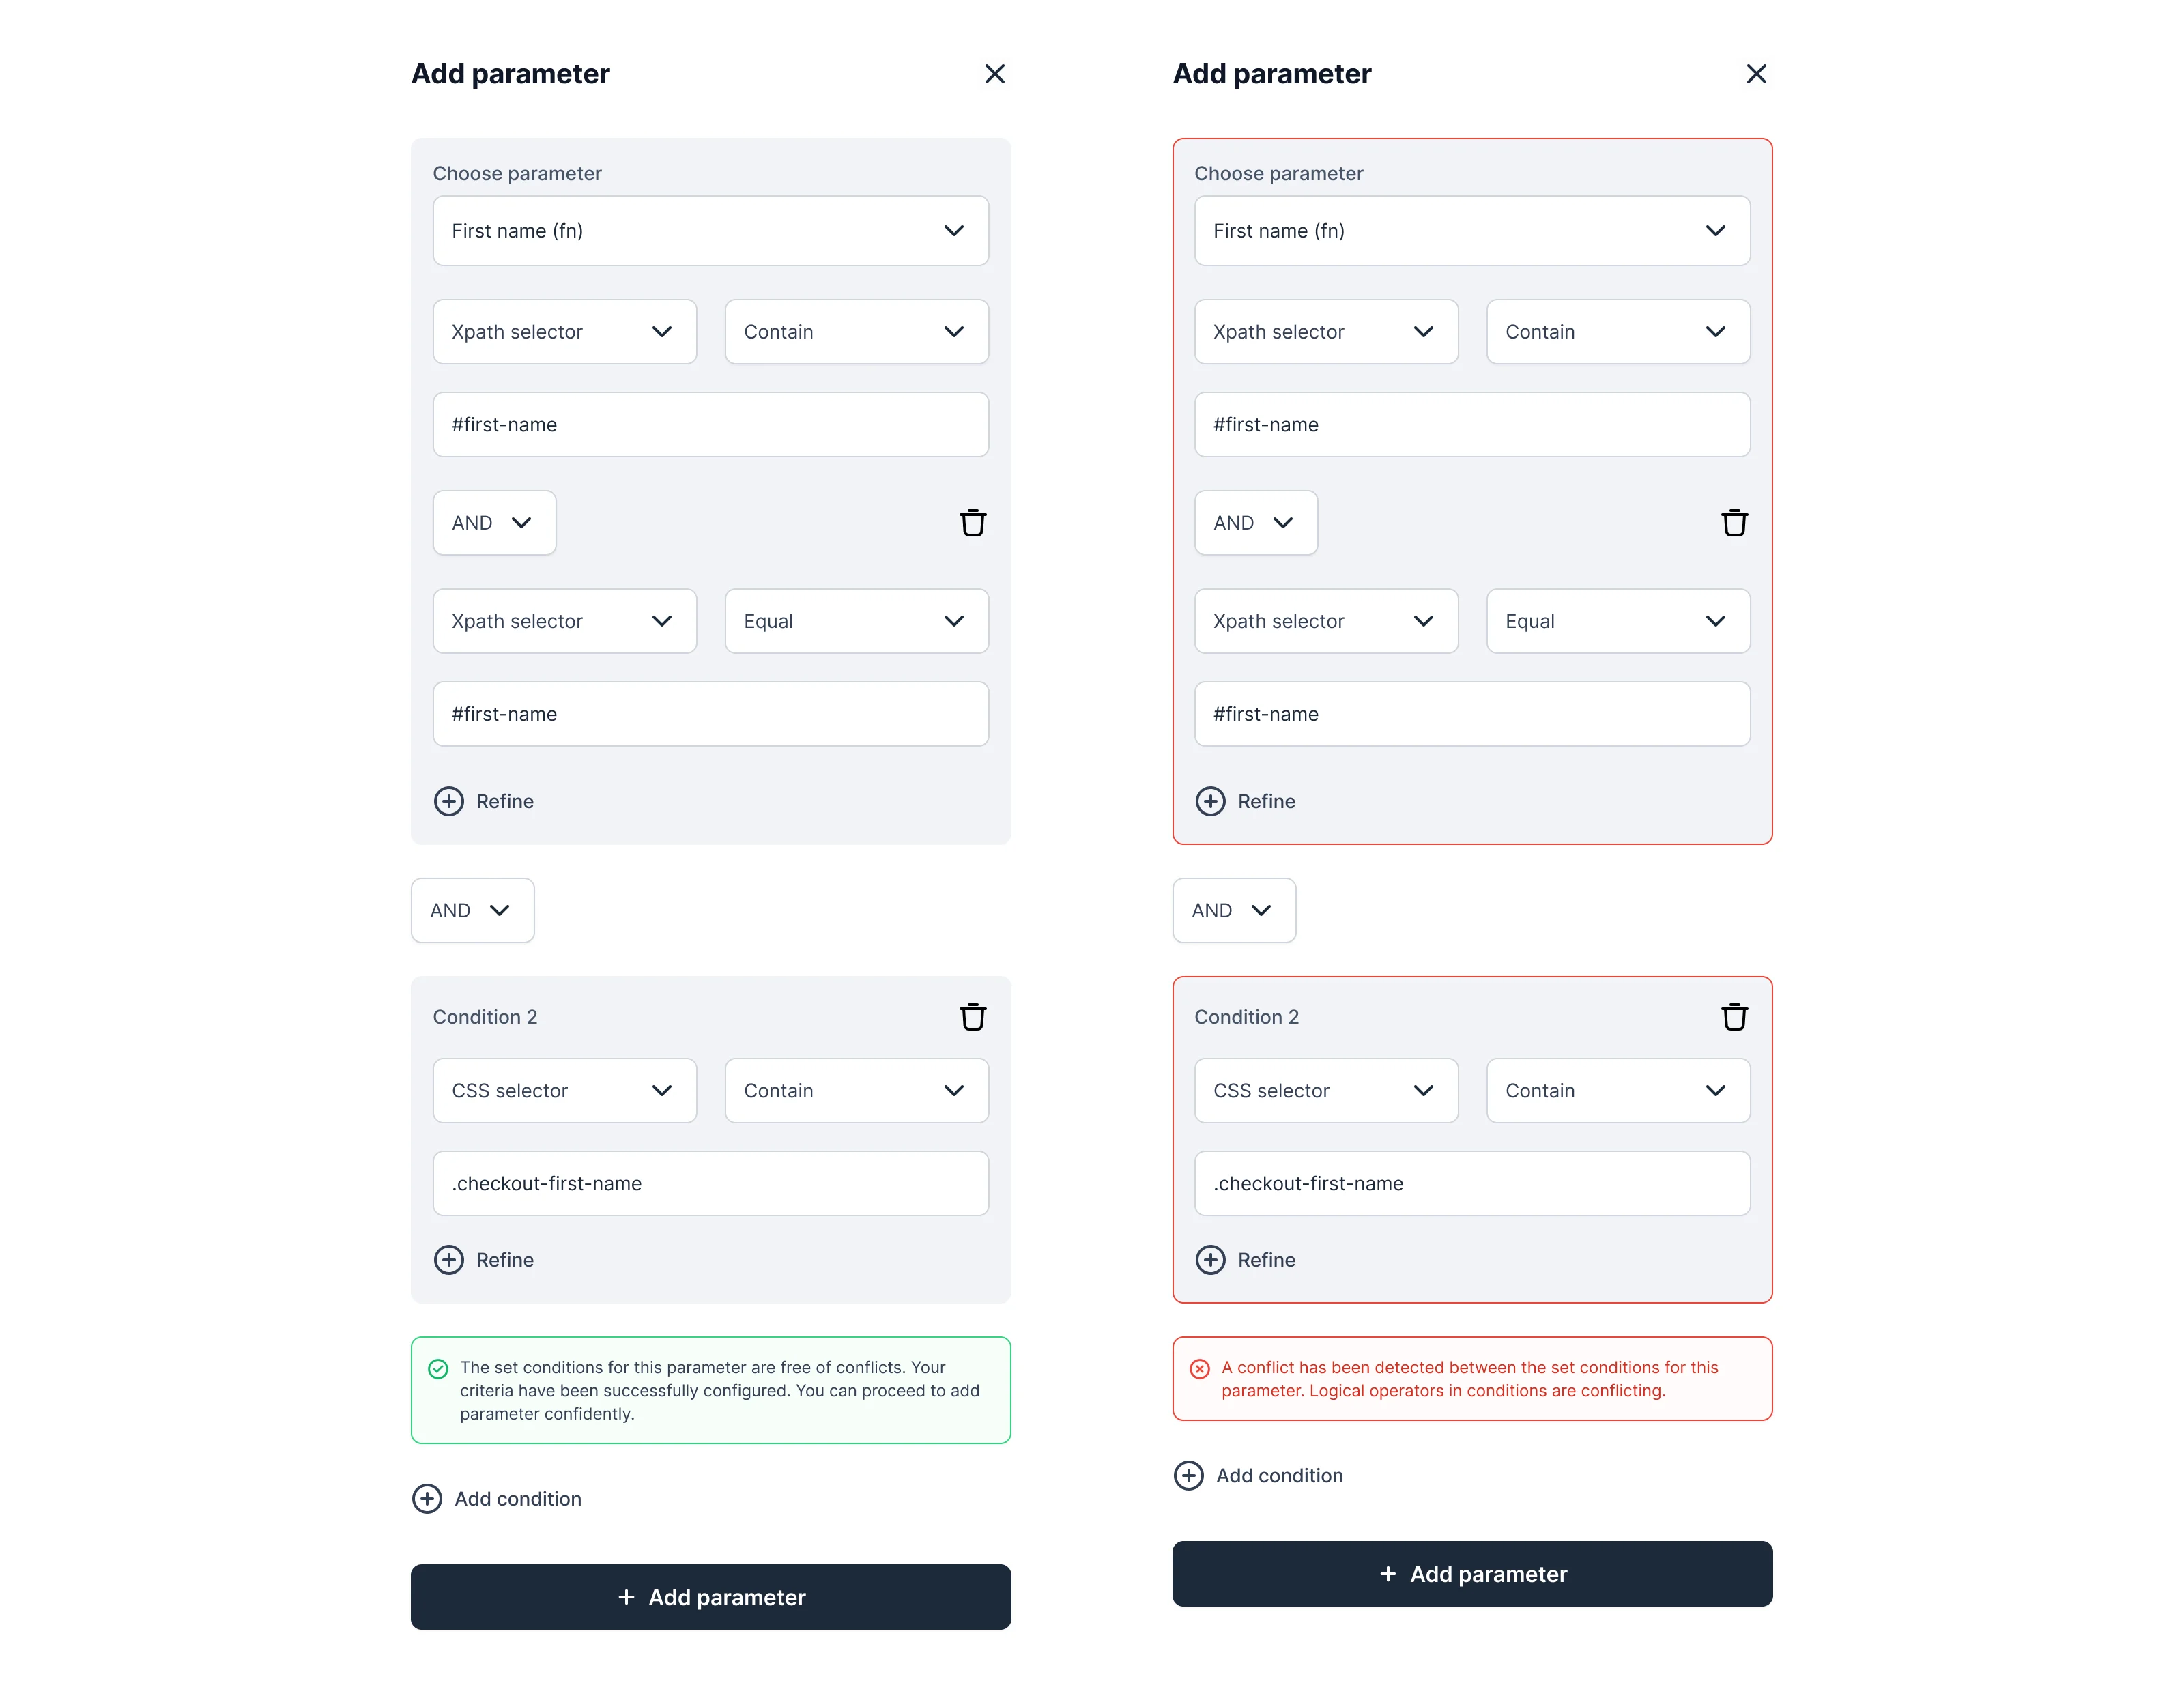
Free of conflicts, then in conflict
Where the product ended up
RoasRocket redesigned from an incomplete legacy reference into a complete desktop product in its light mode: sign-up and onboarding, the Activity Log and events manager, funnels, customer journeys and segments, sources and destinations with Facebook, Meta Pixel, Meta Conversion API, Google Analytics 4 and Google Ads setup, products, sales channels, orders, profile, subscription and checkout.
- screens
- 148
- workflows designed end to end
- 13
- ad and analytics connection setups
- 5
In the client's words
ANODA gave the advertising and CRM information a shared design structure. We appreciated the way the dashboard views were organised to support a clearer discussion of campaign data, leads and attribution without treating each as an isolated tool.

Afraid your analytics will end up a read-only dashboard?
In RoasRocket, journeys, funnels and segments sit one click from the sources, events and destinations that feed them. Bring us your product, and we’ll show you where reading and setting up should meet.
More work like this
Three more products with dense data and specialist users.
-
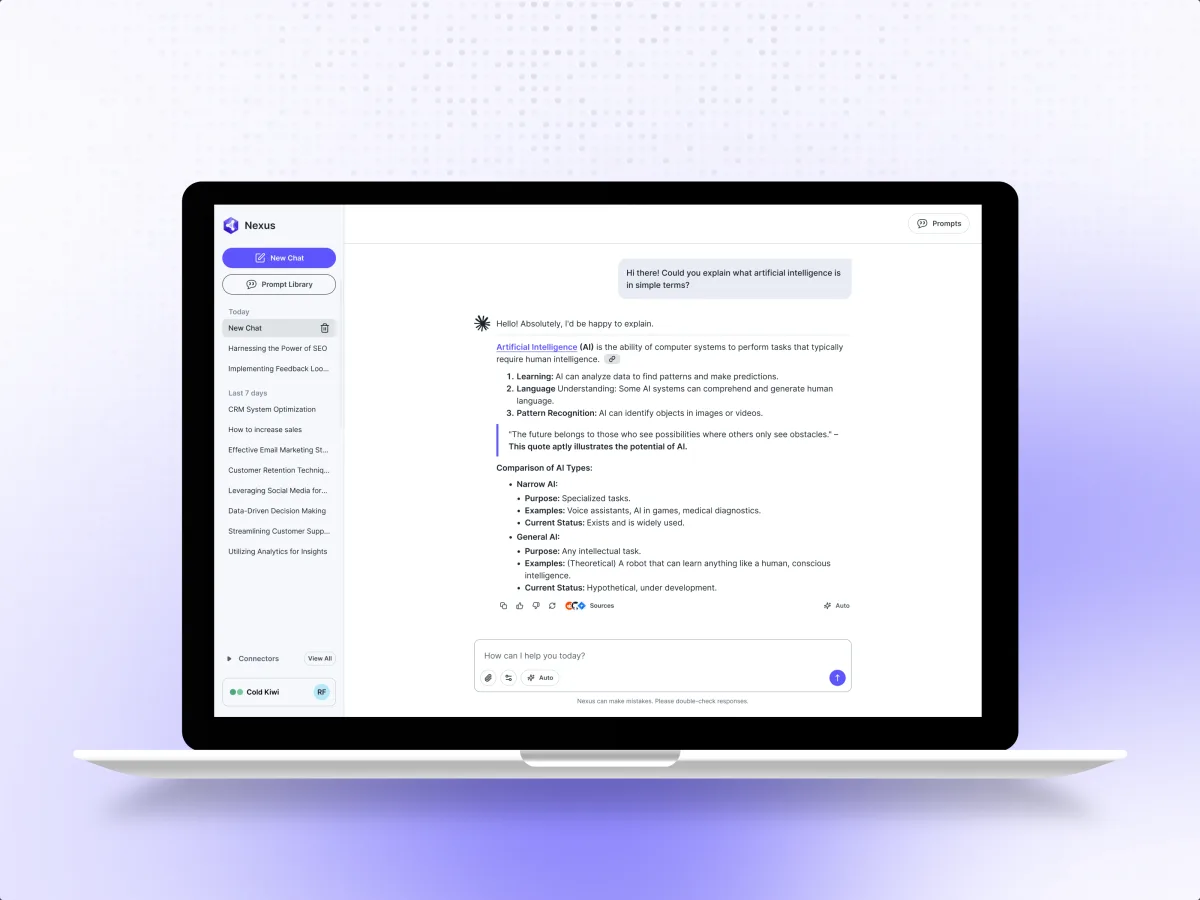
AI · B2B SaaS · Web app
Nexus
Designed an enterprise agentic AI product: an agent builder, browser tasks people can watch or take over, and a vault for the data they use.
- 200+ Unique screens
- 3 Experts on the team
-
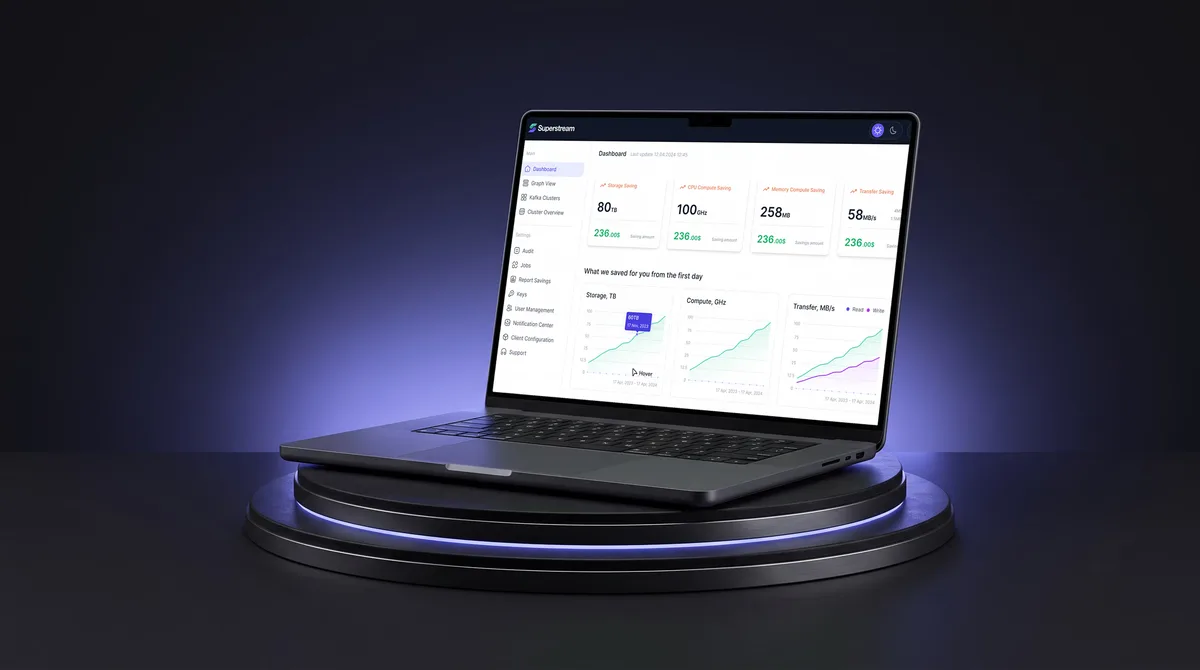
AI Hi-Tech · SaaS
Superstream
Turned a Kafka management platform’s dense technical data into one calm, consistent interface for DevOps teams.
- 3000+ Screens designed
- 1500h+ Design hours
-
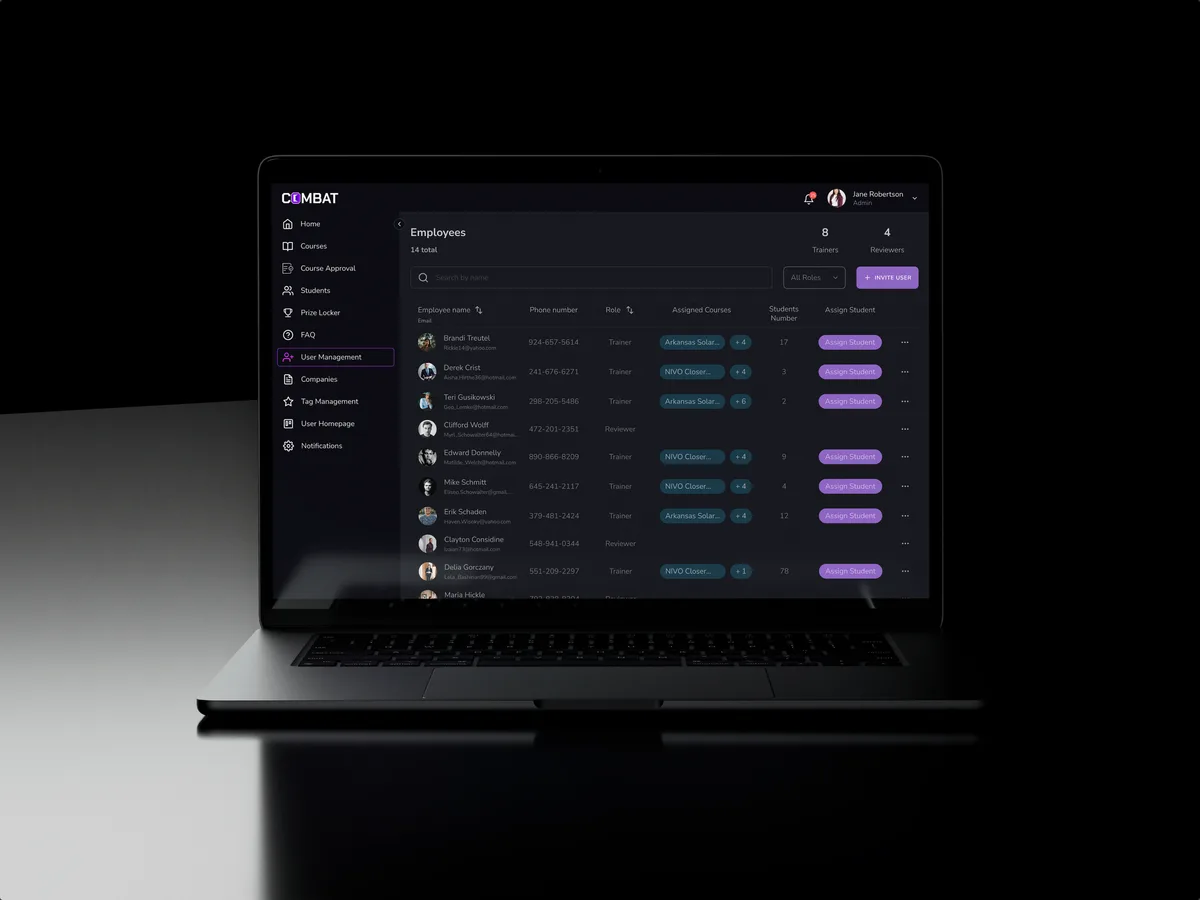
Sales training · Desktop web platform
Combat Sales
Reworked a sales training platform for five roles without moving the places its users already knew.
- 80+ Final desktop screens and interaction states
- 5 Roles in one platform