Geospatial & Map Interface Design
Design the map screens people plan and work from — layers they can read, areas they can draw, points they can sample, and routes that take them to the right spot on the ground.

- Desk and field
- Planning on screen, work on site
- Layers, polygons, sampling
- Drawing tools with exact coordinates
- Designed on real maps
- Your imagery and data, not placeholders
- Custom scope
- Fixed or phased, set in the proposal
In short
Maps people can read, draw on and navigate by, from the planning desk to the spot in the field.
What's included
- Layers and legends
- Polygons and zones
- Sampling points
- Field navigation
- Location-linked records
- Offline and GPS states
Answers you'll have before development
- Which layer does each role need first?
- What has to work in the field, one-handed?
- Where does the map end and the list take over?
Where it stops
Charts, figures and analytical layouts on one screen.
Geospatial & Map Interface Design
Work done on the map itself: layers, areas, points and routes.
Not included
- GIS engineering, map data or imagery processing
- Yield, accuracy or field-efficiency figures
The map designed as a tool, not a picture
A map interface fails when it only shows data. The design starts from what people do with a place — plan it, mark it, sample it, get to it — and builds the map around that.
-
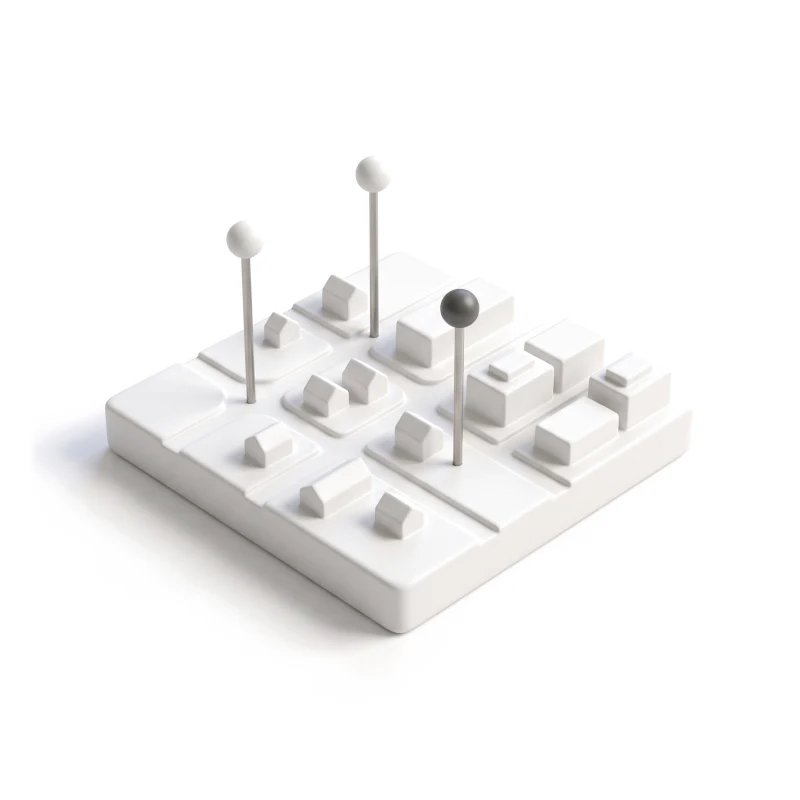
Spatial workflow map
Each job from desk to field: what is planned on the map and what is done on the ground.
-
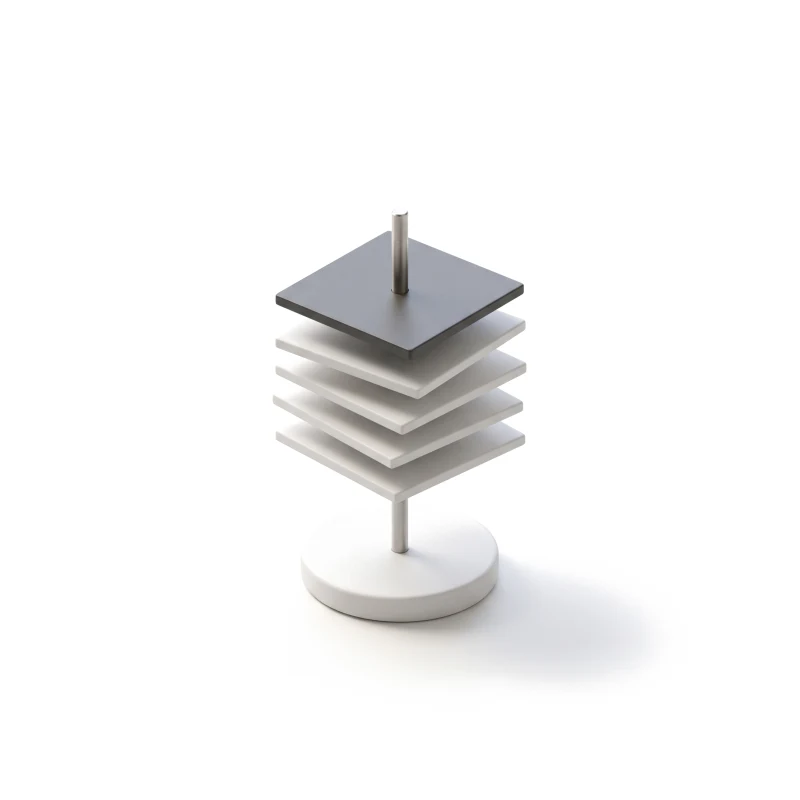
Layer and legend system
Imagery, data layers and markers stacked so the one that matters reads first.
-
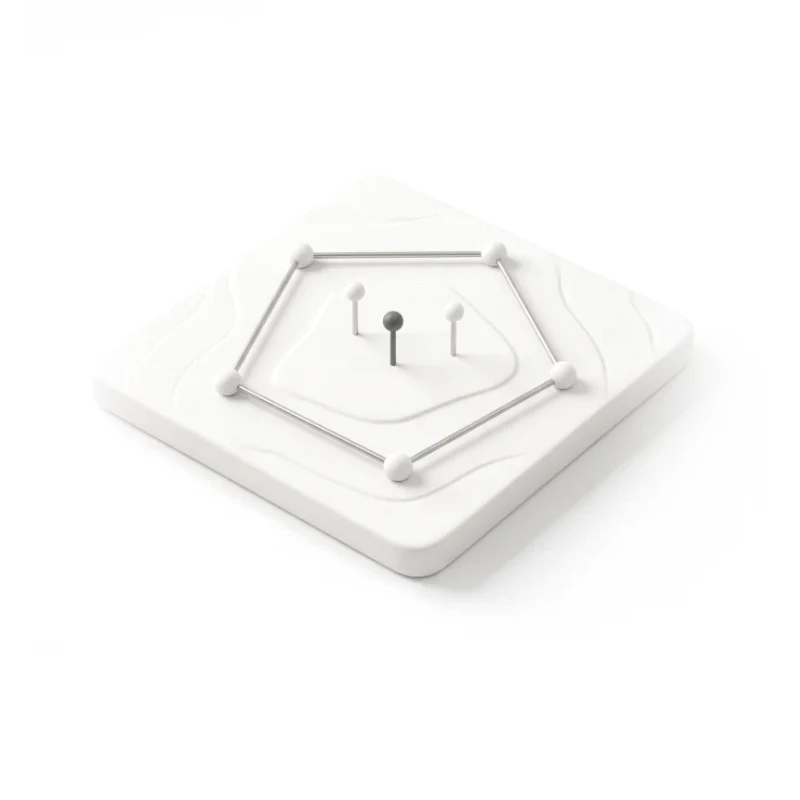
Drawing and sampling tools
Polygons, zones and sample points, with editing, snapping and exact coordinates.
-
Field navigation
Routes to a row, a point or a marker, with big targets and a weak signal in mind.
You receive
- Spatial workflows for each role
- A layer and state matrix
- UI and a clickable prototype
- Notes on the map data needed
Designed for the map in the sun, not only on the monitor.
Map UX design has two tests: can someone read five layers at a glance at a desk, and can someone find the right spot with muddy hands and a weak signal. Every screen is drawn for both.
Every screen is designed for
- Imagery still loading
- No data for this area
- Layers competing for attention
- Polygon not closed
- Point outside the boundary
- Weak GPS, position drifting
- Offline in the field
- Changed since the last sync
- Zoomed out, thousands of markers
Map products we have designed
Aerial imagery turned into field work, on the desk and in the rows.
-
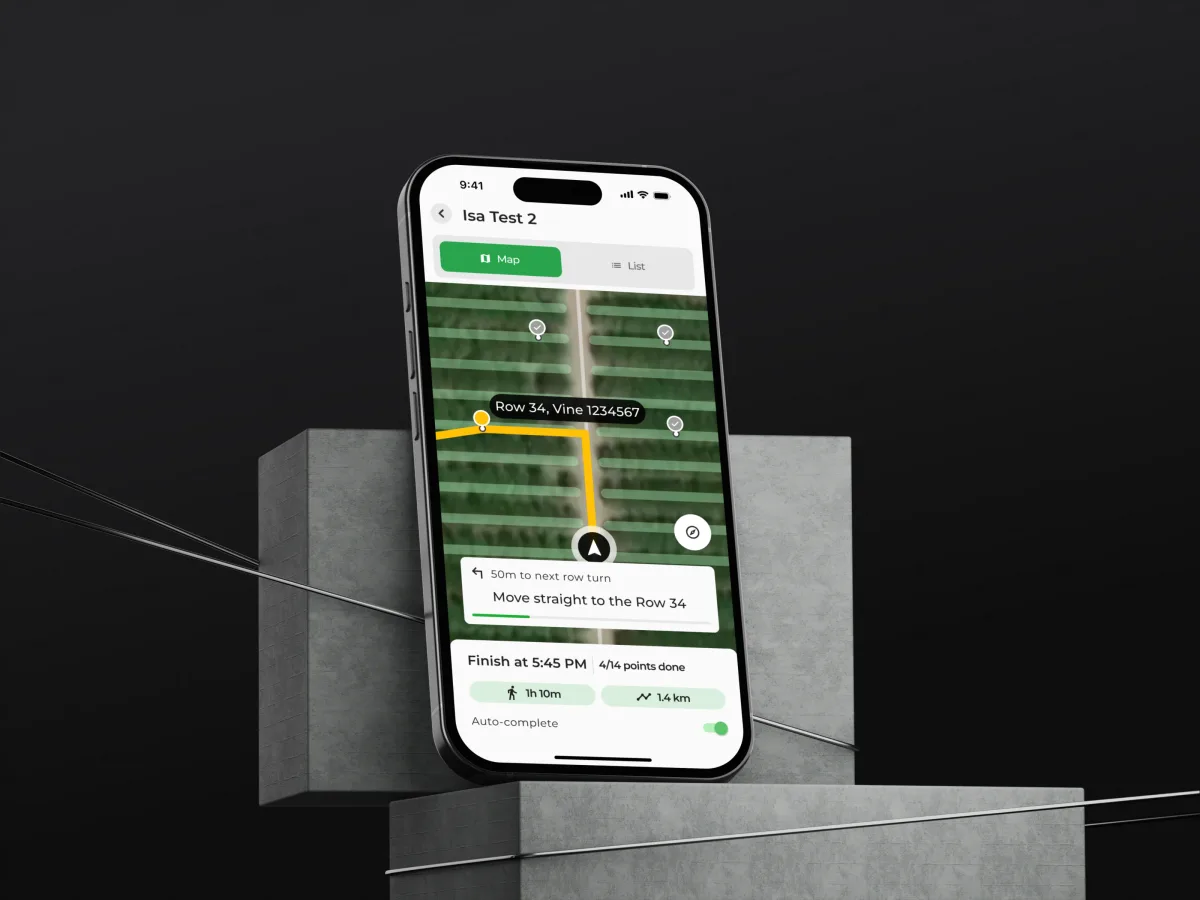
AgTech · SaaS · Web + Mobile
VineView
Turned aerial vineyard imagery into tools growers use — yield estimation on the desktop, and a mobile app to draw blocks, plan sampling and walk the rows vine by vine.
- 150+ Unique screens
- 4 Major features designed
When geospatial UX design is the right frame
It fits when the map is where the work happens, not a picture beside it.
-
People work on the map
They plan, draw, mark or decide on it — not only look at it.
-
Data has a place
Imagery, samples, assets or records tied to a point or an area.
-
Work goes into the field
On a phone or tablet, outdoors, often with a weak signal.
-
Roles share one map
Planners, field teams and admins each need different layers.
Let's put your data on a map people can use
Tell us what the map shows and what people do with it. We will come back with the service that fits and a realistic next step.
Scope, access and who does what
Map products are best taken one spatial workflow at a time, through one of our services. Its proposal sets the terms.
- Scope
- Per service fixed or phased, set in the proposal
- Timeline
- Agreed after scope, access and dependencies
-
You provide
- The product
- Access to the current tool or prototype, with a test account for each role.
- Real map data
- Sample imagery, layers and records for an area people actually work in.
- The field
- Time with the people who use the map outdoors, and how they work there.
- Engineering
- The map stack, tile and data limits, and what works offline.
-
Who does what
- ANODA
- Maps the spatial workflows, designs the layers, drawing tools, navigation and states with their screens, and documents the data each one needs.
- Your team
- Provides the map stack and data, reviews each step, builds the product and tests it in the field.
-
Boundaries
- Outside map interface design
- GIS engineering, map data licensing, imagery capture and processing, analytics models and development.
- After the design
- Your team builds the product and tests it on site. We can check the built map against the design too, under its own scope.
In the client's words
The design work helped organise the vineyard information into a consistent interface direction. We appreciated the attention to how imagery, field context and proposed actions appear together, so the team could review the product through specific workflows.
What do people need to do on your map?
Tell us what the data is, who works with it, and whether they use it at a desk, in the field, or both.
Message received.
Within 15 minutes, we’ll email you initial feedback and follow-up questions.
Geospatial & Map Interface Design: common questions
How can we tell whether a team really knows geospatial UX design, not just good-looking maps?
Ask to see a map product designed with its awkward cases: overlapping layers, an unclosed polygon, a point outside the boundary, a weak GPS fix, a field with no signal. Ask whether the team designed on real imagery or on a placeholder, how it handled thousands of markers, and what it did for people outdoors. Our VineView case shows a working field tool.
What would you design for our map product, and what makes the scope grow?
A spatial workflow map, a layer and legend system, drawing and sampling tools, field navigation, a clickable prototype of the UI, and a note of what map data engineering must supply. Cost and timeline depend on the number of spatial tasks and roles, the platforms, whether offline use is in scope, and how much of a live product stays. They are set in the proposal for the service you start with.
Desk or field: who does GIS interface design have to serve, and in which tasks?
Planners and analysts who read layers and draw zones at a desk, field teams who navigate to points and record what they find, managers who review progress on the map, and admins who set up areas, markers and access. The workflows are choosing and comparing layers, drawing and editing polygons, placing sample points, routing to a location, attaching records, photos and notes to a place, and syncing field work back.
Which ANODA services fit a map product, and where do we start?
Product Discovery helps choose the first spatial task, and a UX Audit finds where a live map loses people. A new map product goes to UI/UX & Product Design, the planning side to Web App Design and the field side to Mobile App Design. Dashboard Design fits when the job is map data visualization inside charts and figures, and Usability Testing lets field teams try the map on site.
What does the map do when imagery is still loading, GPS drifts or there is no signal in the field?
On real map data, not a clean mock-up. Every screen is drawn for imagery still loading, no data for an area, layers competing for attention, an unclosed polygon, a point outside the boundary, drifting GPS, no signal, changes since the last sync and thousands of markers when zoomed out. Permissions decide who can see which layers and who can draw, edit or approve an area.
What do you need from our team to start?
Access to the tool or prototype with a test account per role, sample imagery and layers for an area people really work in, time with the people who use the map outdoors, and the engineers who know the map stack, its tile and data limits and what works offline.
Which geospatial and map products have you designed?
VineView, an aerial imagery platform for vineyards — 150+ unique screens, with 4 major features designed across 2 platforms, web and mobile.
Our map product is live on a map library we chose. Can you design within it?
Yes. On VineView every new map tool landed inside a live product growers already knew, matched to its look and logic. We design around the map library and data you use, in your own files, with your engineers and field teams checking each step.